
Page 865 - MARSIUM'21 COMP OF PAPER
P. 865
866
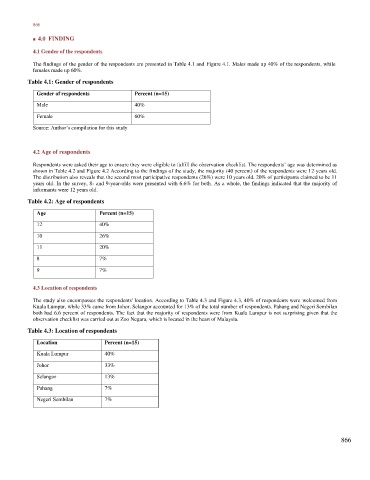
■ 4.0 FINDING
4.1 Gender of the respondents
The findings of the gender of the respondents are presented in Table 4.1 and Figure 4.1. Males made up 40% of the respondents, while
females made up 60%.
Table 4.1: Gender of respondents
Gender of respondents Percent (n=15)
Male 40%
Female 60%
Source: Author’s compilation for this study
4.2 Age of respondents
Respondents were asked their age to ensure they were eligible to fulfill the observation checklist. The respondents’ age was determined as
shown in Table 4.2 and Figure 4.2 According to the findings of the study, the majority (40 percent) of the respondents were 12 years old.
The distribution also reveals that the second most participative respondents (26%) were 10 years old. 20% of participants claimed to be 11
years old. In the survey, 8- and 9-year-olds were presented with 6.6% for both. As a whole, the findings indicated that the majority of
informants were 12 years old.
Table 4.2: Age of respondents
Age Percent (n=15)
12 40%
10 26%
11 20%
8 7%
9 7%
4.3 Location of respondents
The study also encompasses the respondents' location. According to Table 4.3 and Figure 4.3, 40% of respondents were welcomed from
Kuala Lumpur, while 33% came from Johor. Selangor accounted for 13% of the total number of respondents. Pahang and Negeri Sembilan
both had 6.6 percent of respondents. The fact that the majority of respondents were from Kuala Lumpur is not surprising given that the
observation checklist was carried out at Zoo Negara, which is located in the heart of Malaysia.
Table 4.3: Location of respondents
Location Percent (n=15)
Kuala Lumpur 40%
Johor 33%
Selangor 13%
Pahang 7%
Negeri Sembilan 7%
866