
Page 943 - MARSIUM'21 COMP OF PAPER
P. 943
944 Teo & Dr Adaviah (2021)
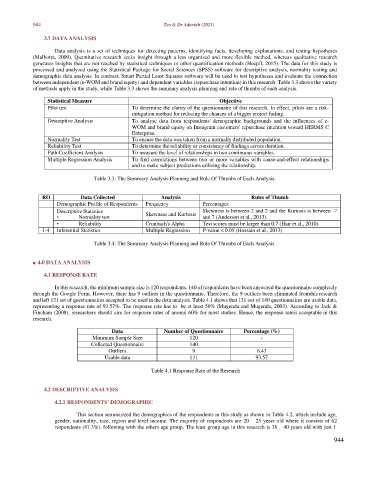
3.7 DATA ANALYSIS
Data analysis is a set of techniques for detecting patterns, identifying facts, developing explanations, and testing hypotheses
(Malhotra, 2009). Quantitative research seeks insight through a less organized and more flexible method, whereas qualitative research
generates insights that are not reached by statistical techniques or other quantification methods (Hoepfl, 2015). The data for this study is
processed and analyzed using the Statistical Package for Social Sciences (SPSS) software for descriptive analysis, normality testing and
demographic data analysis. In contrast, Smart Partial Least Squares software will be used to test hypotheses and evaluate the connection
between independent (e-WOM and brand equity) and dependent variables (repurchase intention) in this research. Table 3.3 shows the variety
of methods apply in the study, while Table 3.3 shows the summary analysis planning and rule of thumbs of each analysis.
Statistical Measure Objective
Pilot test To determine the clarity of the questionnaire of this research. In effect, pilots are a risk-
mitigation method for reducing the chances of a bigger project failing.
Descriptive Analysis To analyse data from respondents' demographic backgrounds and the influences of e-
WOM and brand equity on Instagram customers' repurchase intention toward HERMS C
Enterprise.
Normality Test To ensure the data was taken from a normally distributed population.
Reliability Test To determine the reliability or consistency of findings across duration.
Path Coefficient Analysis To measure the level of relationships in two continuous variables.
Multiple Regression Analysis To find correlations between two or more variables with cause-and-effect relationships
and to make subject predictions utilizing the relationship.
Table 3.3: The Summary Analysis Planning and Rule Of Thumbs of Each Analysis.
RO Data Collected Analysis Rules of Thumb
Demographic Profile of Respondents Frequency Percentages
Descriptive Statistics Skewness and Kurtosis Skewness is between-2 and 2 and the Kurtosis is between -7
• Normality test and 7 (Anderson et al., 2013).
• Reliability Cronbach's Alpha Test scores must be larger than 0.7 (Hair et al., 2010).
1-4 Inferential Statistics Multiple Regression P-value < 0.05 (Hossain et al., 2013)
Table 3.4: The Summary Analysis Planning and Rule Of Thumbs of Each Analysis.
■ 4.0 DATA ANALYSIS
4.1 RESPONSE RATE
In this research, the minimum sample size is 120 respondents. 140 of respondents have been answered the questionnaire completely
through the Google Form. However, there has 9 outliers in the questionnaire. Therefore, the 9 outliers been eliminated from this research
and left 131 set of questionnaires accepted to be used in the data analysis. Table 4.1 shows that 131 out of 140 questionnaires are usable data,
representing a response rate of 93.57%. The response rate has to be at least 50% (Mugenda and Mugenda, 2003). According to Jack &
Fincham (2008), researchers should aim for response rates of around 60% for most studies. Hence, the response rate is acceptable in this
research.
Data Number of Questionnaire Percentage (%)
Minimum Sample Size 120 -
Collected Questionnaire 140 -
Outliers 9 6.43
Usable data 131 93.57
Table 4.1 Response Rate of the Research
4.2 DESCRIPTIVE ANALYSIS
4.2.1 RESPONDENTS’ DEMOGRAPHIC
This section summarized the demographics of the respondents in this study as shown in Table 4.2, which include age,
gender, nationality, race, region and level income. The majority of respondents are 20 – 25 years old where it consists of 62
respondents (47.3%), following with the others age group. The least group age in this research is 36 – 40 years old with just 1
944