Page 945 - MARSIUM'21 COMP OF PAPER
P. 945

946                                        Teo & Dr Adaviah (2021)

                               Variable                       Skewness                    Kurtosis
                                                        Statistic    Std. Error    Statistic     Std. Error
                             Brand Equity               -0.171        0.212         -0.224         0.420
                               e-WOM                    0.162         0.212         -0.369         0.420
                       User Generated Social Media      0.134         0.212         -0.166         0.420
                            Communication
                       Firm Generated Social Media      -0.010        0.212         0.104          0.420
                            Communication
                          Repurchase Intention          -0.264        0.212         0.089          0.420

                                              Table 4.4: Skewness and Kurtosis Normality


                4.3 VALIDITY ANALYSIS

                   4.3.1 CONSTRUCT VALIDITY

                          According to Mohajan (2017), construct validity is particularly essential for empirical measurements and testing of
                   hypotheses in theory creation. To determine the construct validity, researchers conducted a study in which  they examined whether
                   the test's variables aligned with theoretical predictions (Sekaran & Bougie, 2010). Convergent and discriminant validity are the
                   two categories of construct validity. These two categories are aimed to ensure that the instruments are compatible with the concept
                   of speculation. For the best results, the loading value should be more than 0.5, as stated by Hair et al. (2010).

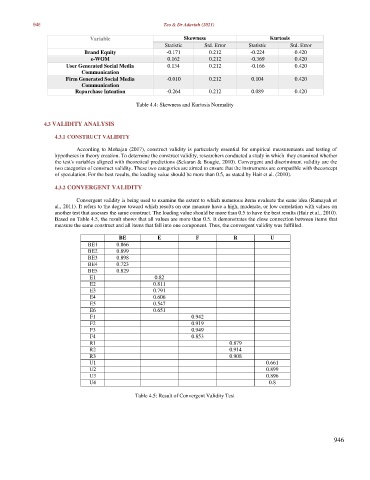
                   4.3.2 CONVERGENT VALIDITY

                          Convergent validity is being used to examine the extent to which numerous items evaluate the same idea (Ramayah et
                   al., 2011). It refers to the degree toward which results on one measure have a high, moderate, or low correlation with values on
                   another test that assesses the same construct. The loading value should be more than 0.5 to have the best results (Hair et al., 2010).
                   Based on Table 4.5, the result shows that all values are more than 0.5. It demonstrates the close connection between items that
                   measure the same construct and all items that fall into one component. Thus, the convergent validity was fulfilled.

                                        BE           E            F           R           U
                              BE1       0.866
                              BE2       0.899
                              BE3       0.898
                              BE4       0.723
                              BE5       0.829
                               E1                   0.82
                               E2                   0.811
                               E3                   0.791
                               E4                   0.606
                               E5                   0.547
                               E6                   0.651
                               F1                               0.942
                               F2                               0.919
                               F3                               0.949
                               F4                               0.853
                               R1                                            0.879
                               R2                                            0.914
                               R3                                            0.908
                               U1                                                        0.661
                               U2                                                        0.899
                               U3                                                        0.896
                               U4                                                         0.8

                                              Table 4.5: Result of Convergent Validity Test


                                                                                                                946
   940   941   942   943   944   945   946   947   948   949   950