
Page 946 - MARSIUM'21 COMP OF PAPER
P. 946
947 Teo & Dr Adaviah (2021)
4.2.2 DISCRIMINANT VALIDITY
Discriminant validity refers to the degree whereby the constructs genuinely differ empirically from each other. It also
assesses the extent to which the overlapping constructs differ from one another (Hair et al., 2014). Based on the Table 4.6, all of
the values in the same construct are greater than those in other constructs. Hence, the discriminant validity is established.
BE E F R U
BE 0.846
E 0.702 0.713
F 0.525 0.575 0.917
R 0.726 0.596 0.484 0.901
U 0.527 0.629 0.863 0.508 0.82
Table 4.6: Discriminant Validity Assessment
4.3 RELIABILITY ANALYSIS
This research employs a reliability analysis. Reliability is a term that refers to a tool that enables researchers to determine the
quality of a questionnaire and prevent producing biased results. It is mandatory to evaluate the reliability of the scales and variables employed.
In terms of Cronbach’s Alpha, 0.9 and above is good, while 0.6 is consider acceptable, yet 0.5 and below is consider poor (George & Mallery,
2003; Bhatnagar et al., 2014). Based on Table 4.7, all values of Cronbach’s Alpha are consider acceptable as they are in the range from 0.811
to 0.936.
According to Hair et al. (2014), composite reliability values between 0.60 and 0.70 are acceptable, but in a more advanced stage,
the value has to be greater than 0.70 to be considered reliable. Table 4.7 shows that the composite reliability results are acceptable and
consider reliable where the values are greater than 0.7.
Barclay et al. (1995) stipulate that the AVE analysis have to be larger than 0.5. Based on Table 4.7, all the value of AVE are greater
than 0.5 where the values are in the range of 0.508 to 0.84. This indicates that all the dimensions are valid and acceptable for determining
the AVE value. As a result, the data are reliable and acceptable for use.
Average Variance
Cronbach's Alpha rho_A Composite Reliability
Extracted (AVE)
BE 0.899 0.903 0.926 0.715
E 0.811 0.852 0.858 0.508
F 0.936 0.939 0.955 0.84
R 0.884 0.889 0.928 0.811
U 0.83 0.827 0.89 0.672
Table 4.7: Reliability Analysis Result
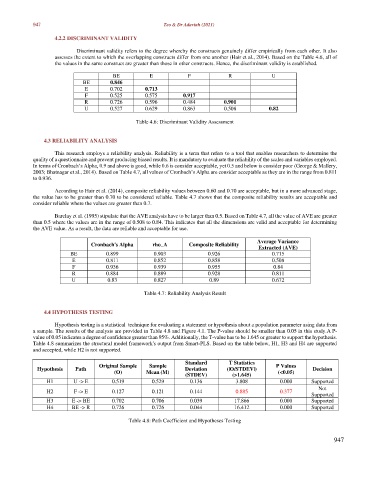
4.4 HYPOTHESIS TESTING
Hypothesis testing is a statistical technique for evaluating a statement or hypothesis about a population parameter using data from
a sample. The results of the analysis are provided in Table 4.8 and Figure 4.1. The P-value should be smaller than 0.05 in this study. A P-
value of 0.05 indicates a degree of confidence greater than 95%. Additionally, the T-value has to be 1.645 or greater to support the hypothesis.
Table 4.8 summarizes the structural model framework's output from Smart-PLS. Based on the table below, H1, H3 and H4 are supported
and accepted, while H2 is not supported.
Original Sample Sample Standard T Statistics P Values
Hypothesis Path Deviation (|O/STDEV|) Decision
(O) Mean (M) (STDEV) (>1.645) (<0.05)
H1 U -> E 0.519 0.529 0.136 3.808 0.000 Supported
Not
H2 F -> E 0.127 0.121 0.144 0.885 0.377
Supported
H3 E -> BE 0.702 0.706 0.039 17.866 0.000 Supported
H4 BE -> R 0.726 0.726 0.044 16.412 0.000 Supported
Table 4.8: Path Coefficient and Hypotheses Testing
947