Page 944 - MARSIUM'21 COMP OF PAPER
P. 944

945                                        Teo & Dr Adaviah (2021)

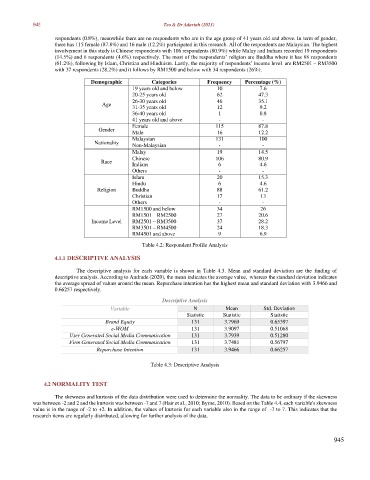
                   respondents (0.8%), meanwhile there are no respondents who are in the age group of 41 years old and above. In term of gender,
                   there has 115 female (87.8%) and 16 male (12.2%) participated in this research. All of the respondents are Malaysian. The highest
                   involvement in this study is Chinese respondents with 106 respondents (80.9%) while Malay and Indians recorded 19 respondents
                   (14.5%) and 6 respondents (4.6%) respectively. The most of the respondents’ religion are Buddha where it has 88 respondents
                   (61.2%), following by Islam, Christian and Hinduism. Lastly, the majority of respondents’ income level  are RM2501 – RM3500
                   with 37 respondents (28.2%) and it follows by RM1500 and below with 34 respondents (26%).

                               Demographic         Categories         Frequency   Percentage (%)
                                             19 years old and below      10            7.6
                                             20-25 years old             62            47.3
                                             26-30 years old             46            35.1
                                   Age
                                             31-35 years old             12            9.2
                                             36-40 years old             1             0.8
                                             41 years old and above      -              -
                                             Female                     115            87.8
                                  Gender
                                             Male                        16            12.2
                                             Malaysian                  131            100
                                Nationality
                                             Non-Malaysian               -              -
                                             Malay                       19            14.5
                                             Chinese                    106            80.9
                                  Race       Indians                     6             4.6
                                             Others                      -              -
                                             Islam                       20            15.3
                                             Hindu                       6             4.6
                                 Religion    Buddha                      88            61.2
                                             Christian                   17            13
                                             Others                      -              -
                                             RM1500 and below            34            26
                                             RM1501 – RM2500             27            20.6
                               Income Level   RM2501 – RM3500            37            28.2
                                             RM3501 – RM4500             24            18.3
                                             RM4501 and above            9             6.9
                                                Table 4.2: Respondent Profile Analysis

                   4.1.1 DESCRIPTIVE ANALYSIS

                          The  descriptive  analysis  for  each  variable  is  shown  in  Table  4.3.  Mean  and  standard  deviation  are  the  finding  of
                   descriptive analysis. According to Andrade (2020), the mean indicates the average value,  whereas the standard deviation indicates
                   the average spread of values around the mean. Repurchase intention has the highest mean and standard deviation with 3.9466 and
                   0.66257 respectively.
                                                       Descriptive Analysis

                                      Variable                   N          Mean        Std. Deviation
                                                               Statistic   Statistic       Statistic
                                    Brand Equity                131        3.7969          0.65397
                                      e-WOM                     131        3.9097         0.51068
                        User Generated Social Media Communication   131    3.7939         0.51280
                        Firm Generated Social Media Communication   131    3.7481         0.56797
                                 Repurchase Intention           131        3.9466         0.66257

                                                   Table 4.3: Descriptive Analysis


                4.2 NORMALITY TEST

                   The skewness and kurtosis of the data distribution were used to determine the normality. The data to be ordinary if the skewness
            was between -2 and 2 and the kurtosis was between -7 and 7 (Hair et al., 2010; Byrne, 2010). Based on the Table 4.4, each variable's skewness
            value is in the range of -2 to +2. In addition, the values of kurtosis for each variable also in the range of  -7 to 7. This indicates that the
            research items are regularly distributed, allowing for further analysis of the data.


                                                                                                                945
   939   940   941   942   943   944   945   946   947   948   949