
Page 15 - GeoPRISMS_Newsletter_Spring2018_Neat
P. 15
The NZ3D experiment was designed to acquire 3D seismic images stratigraphic horizons. In order to acquire the data needed for FWI,
to map reflectivity and structures, and it provided an opportunity for in December 2017, prior to NZ3D acquisition, the R/V Tangaroa
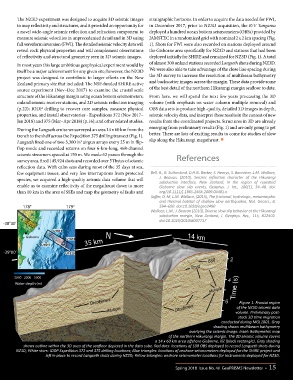
a novel wide-angle seismic reflection and refraction component to deployed a hundred ocean bottom seismometers (OBSs) provided by
measure seismic velocities in unprecedented detail and in 3D using JAMSTEC in a randomized grid with nominal 2 x 2 km spacing (Fig.
full waveform inversion (FWI). The detailed seismic velocity data will 1). Shots for FWI were also recorded on stations deployed around
reveal rock physical properties and will complement observations the Gisborne area specifically for NZ3D and stations that had been
of reflectivity and structural geometry seen in 3D seismic images. deployed initially for SHIRE and remained for NZ3D (Fig. 1). A total
In most years this large ambitious geophysical experiment would by of almost 300 onland stations recorded Langseth shots during NZ3D.
itself be a major achievement for any given site; however, the NZ3D We were also able to take advantage of the close line spacing during
project was designed to contribute to larger efforts on the New the 3D survey to increase the resolution of multibeam bathymetry
Zealand primary site that included: The NSF-funded SHIRE active and backscatter images across the margin. These data provide some
source experiment (Nov–Dec 2017) to examine the crustal scale of the best detail of the northern Hikurangi margin seafloor to date.
structure of the Hikurangi margin using ocean bottom seismometers, From here, we will spend the next few years processing the 3D
onland seismic receiver stations, and 2D seismic reflection imaging volume (with emphasis on water column multiple removal) and
(p.22); IODP drilling to recover core samples, measure physical OBS data sets to produce high-quality, detailed 3D images in depth,
properties, and install observatories - Expeditions 372 (Nov 2017– seismic velocity data, and interpret these results in the context of new
Jan 2018) and 375 (Mar–Apr 2018) (p.16); and other related studies. results from the coordinated projects. Structures in 3D are already
During the Langseth cruise we surveyed an area 14 x 60 km from the emerging from preliminary results (Fig. 1) and are only going to get
trench to the shelf across the Expedition 375 drilling transect (Fig. 1). better. There are lots of exciting results to come for studies of slow
slip along the Hikurangi megathrust. ■
Langseth fired one of two 3,300 in airgun arrays every 25 m in flip-
3
flop mode and recorded returns on four 6-km-long, 468-channel
seismic streamers spaced at 150 m. We made 62 passes through the References
survey area, fired 145,924 shots and recorded over 5Tbytes of seismic
reflection data. With calm seas during most of the 35 days at sea,
few equipment issues, and very few interruptions from protected Bell, R., R. Sutherland, D.H.N. Barker, S. Henrys, S. Bannister, L.M. Wallace,
species, we acquired a high-quality seismic data volume that will J. Beavan, (2010), Seismic reflection character of the Hikurangi
subduction interface, New Zealand, in the region of repeated
enable us to examine reflectivity of the megathrust down to more Gisborne slow slip events, Geophys. J. Int., 180(1), 34–48. doi.
than 10 km in the area of SSEs and map the geometry of faults and org/10.1111/j.1365-246X.2009.04401.x
Saffer, D. M, L.M. Wallace, (2015), The frictional, hydrologic, metamorphic
and thermal habitat of shallow slow earthquakes, Nat. Geosci., 8,
178° 179° 594–600. doi:10.1038/ngeo2490
Wallace, L.M., J. Beavan (2010), Diverse slow slip behavior at the Hikurangi
subduction margin, New Zealand, J. Geophys. Res., 115, B12402.
doi:10.1029/2010JB007717
-38°30’
35 km
-39°00’
3000 2000 1000
Water depth (m)
Figure 1. Frontal region
of the NZ3D seismic data
volume. Preliminary post‐
stack 3D time migration
conducted during MGL1801. Gray
shading shows multibeam bathymetry
overlying the seismic image. Inset: Bathymetric map
of the northern Hikurangi margin. The 3D seismic volume covers
a 14 x 60 km area offshore Gisborne, NZ (black rectangle). Gray shading
shows outline within the 3D area of the seafloor depicted in the data cube. Red dots: locations of 100 OBS deployed to record Langseth shots during
NZ3D; White stars: IODP Expedition 372 and 375 drilling locations; Blue triangles: locations of onshore seismometers deployed for the SHIRE project and
left in place to record Langseth shots during NZ3D; Yellow triangles: onshore seismometer locations for instruments deployed for NZ3D.
Spring 2018 Issue No. 40 GeoPRISMS Newsletter • 15