
Page 28 - MODULE QUALITY TOOLS DMQ 30262
P. 28
DMQ 30262
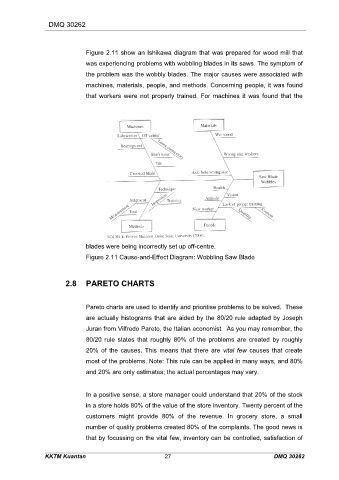
Figure 2.11 show an Ishikawa diagram that was prepared for wood mill that
was experiencing problems with wobbling blades in its saws. The symptom of
the problem was the wobbly blades. The major causes were associated with
machines, materials, people, and methods. Concerning people, it was found
that workers were not properly trained. For machines it was found that the
blades were being incorrectly set up off-centre.
Figure 2.11 Cause-and-Effect Diagram: Wobbling Saw Blade
2.8 PARETO CHARTS
Pareto charts are used to identify and prioritise problems to be solved. These
are actually histograms that are aided by the 80/20 rule adapted by Joseph
Juran from Vilfredo Pareto, the Italian economist. As you may remember, the
80/20 rule states that roughly 80% of the problems are created by roughly
20% of the causes. This means that there are vital few causes that create
most of the problems. Note: This rule can be applied in many ways, and 80%
and 20% are only estimates; the actual percentages may vary.
In a positive sense, a store manager could understand that 20% of the stock
in a store holds 80% of the value of the store inventory. Twenty percent of the
customers might provide 80% of the revenue. In grocery store, a small
number of quality problems created 80% of the complaints. The good news is
that by focussing on the vital few, inventory can be controlled, satisfaction of
KKTM Kuantan 27 DMQ 30262