
Page 30 - MODULE QUALITY TOOLS DMQ 30262
P. 30
DMQ 30262
Solution:
First order the problems by frequency, and compute the percentage of
problems related to each cause.
Type of Problem Frequency Percentage
Setup rountines are not standardised 315 52.1%
Equipment needed for setup is missing 124 20.5%
Internal and external setup tasks are not 87 14.4%
separated
Extensive machine resetting and paper change 56 9.2%
is needed
Others 23 3.8%
Total 605 100%
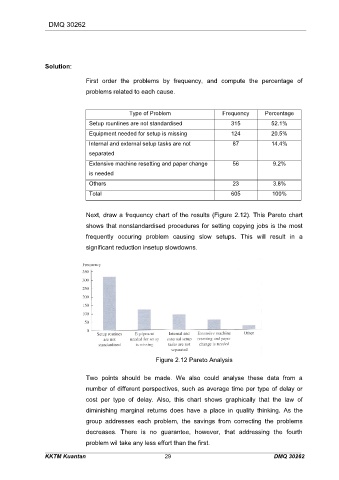
Next, draw a frequency chart of the results (Figure 2.12). This Pareto chart
shows that nonstandardised procedures for setting copying jobs is the most
frequently occuring problem causing slow setups. This will result in a
significant reduction insetup slowdowns.
Figure 2.12 Pareto Analysis
Two points should be made. We also could analyse these data from a
number of different perspectives, such as average time per type of delay or
cost per type of delay. Also, this chart shows graphically that the law of
diminishing marginal returns does have a place in quality thinking. As the
group addresses each problem, the savings from correcting the problems
decreases. There is no guarantee, however, that addressing the fourth
problem wil take any less effort than the first.
KKTM Kuantan 29 DMQ 30262