
Page 27 - MODULE QUALITY TOOLS DMQ 30262
P. 27
DMQ 30262
change is ineffective or even detrimental. This validates effective
improvements, which you will retain. This is enormously difficult when the
process is not in statistical control, because the process instability masks the
results, good or bad, of any changes deliberately made.
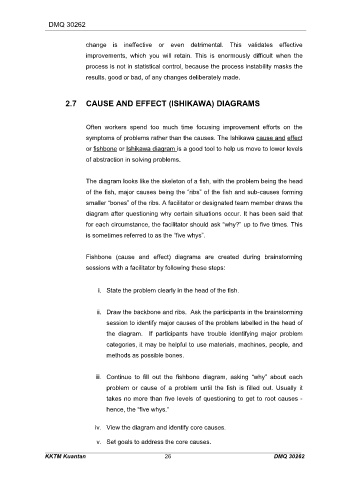
2.7 CAUSE AND EFFECT (ISHIKAWA) DIAGRAMS
Often workers spend too much time focusing improvement efforts on the
symptoms of problems rather than the causes. The Ishikawa cause and effect
or fishbone or Ishikawa diagram is a good tool to help us move to lower levels
of abstraction in solving problems.
The diagram looks like the skeleton of a fish, with the problem being the head
of the fish, major causes being the “ribs” of the fish and sub-causes forming
smaller “bones” of the ribs. A facilitator or designated team member draws the
diagram after questioning why certain situations occur. It has been said that
for each circumstance, the facilitator should ask “why?” up to five times. This
is sometimes referred to as the “five whys”.
Fishbone (cause and effect) diagrams are created during brainstorming
sessions with a facilitator by following these steps:
i. State the problem clearly in the head of the fish.
ii. Draw the backbone and ribs. Ask the participants in the brainstorming
session to identify major causes of the problem labelled in the head of
the diagram. If participants have trouble identifying major problem
categories, it may be helpful to use materials, machines, people, and
methods as possible bones.
iii. Continue to fill out the fishbone diagram, asking “why” about each
problem or cause of a problem until the fish is filled out. Usually it
takes no more than five levels of questioning to get to root causes -
hence, the “five whys.”
iv. View the diagram and identify core causes.
v. Set goals to address the core causes.
KKTM Kuantan 26 DMQ 30262