
Page 29 - MODULE QUALITY TOOLS DMQ 30262
P. 29
DMQ 30262
the most important customers can be increased, 80% of the complaints can
be eliminated.
There are some rules for constructing Pareto charts:
Information must be selected based on types or classifications of defects
that occur as a result of a process. An example of this might be the
different types of defects that occur in a semiconductor.
Data must be collected and classified into categories.
A histogram or frequency chart is constructed showing the number of
occurrences.
The steps used in Pareto analysis include:
a. Gathering categorical data relating to quality problems.
b. Drawing a histogram of the data.
c. Focusing on the tallest bars in the histogram first when solving the
problem.
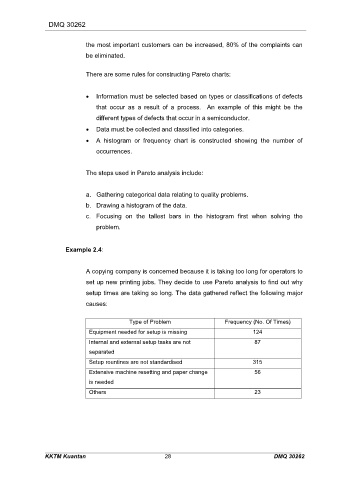
Example 2.4:
A copying company is concerned because it is taking too long for operators to
set up new printing jobs. They decide to use Pareto analysis to find out why
setup times are taking so long. The data gathered reflect the following major
causes:
Type of Problem Frequency (No. Of Times)
Equipment needed for setup is missing 124
Internal and external setup tasks are not 87
separated
Setup rountines are not standardised 315
Extensive machine resetting and paper change 56
is needed
Others 23
KKTM Kuantan 28 DMQ 30262