
Page 69 - MODULE QUALITY TOOLS DMQ 30262
P. 69
DMQ 30262
Where will the measurements be taken?
How will the measurements be taken?
When will the measurements be taken?
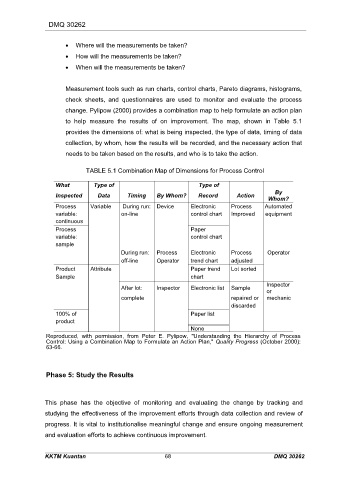
Measurement tools such as run charts, control charts, Pareto diagrams, histograms,
check sheets, and questionnaires are used to monitor and evaluate the process
change. Pylipow (2000) provides a combination map to help formulate an action plan
to help measure the results of on improvement. The map, shown in Table 5.1
provides the dimensions of: what is being inspected, the type of data, timing of data
collection, by whom, how the results will be recorded, and the necessary action that
needs to be taken based on the results, and who is to take the action.
TABLE 5.1 Combination Map of Dimensions for Process Control
What Type of Type of
By
Inspected Data Timing By Whom? Record Action
Whom?
Process Variable During run: Device Electronic Process Automated
variable: on-line control chart Improved equipment
continuous
Process Paper
variable: control chart
sample
During run: Process Electronic Process Operator
off-line Operator trend chart adjusted
Product Attribute Paper trend Lot sorted
Sample chart
Inspector
After lot: Inspector Electronic list Sample
or
complete repaired or mechanic
discarded
100% of Paper list
product
None
Reproduced, with permission, from Peter E. Pylipow, "Understanding the Hierarchy of Process
Control: Using a Combination Map to Formulate an Action Plan," Quality Progress (October 2000):
63-66.
Phase 5: Study the Results
This phase has the objective of monitoring and evaluating the change by tracking and
studying the effectiveness of the improvement efforts through data collection and review of
progress. It is vital to institutionalise meaningful change and ensure ongoing measurement
and evaluation efforts to achieve continuous improvement.
KKTM Kuantan 68 DMQ 30262