
Page 125 - spectroscopic-atlas-5_0-english_Neat
P. 125
Spectroscopic Atlas for Amateur Astronomers 125
broadened, due to the shock sensitivity of the metastable initial states. In contrast to the
emission of the H-Balmer series, they are probably generated far away from the turbulent
core around the supermassive black hole, whose mass is estimated to be ~15 Million M
[Hubble ESA, Garching]. In contrast to the permitted lines they show therefore virtually no
intensity fluctuations.
Also remarkable are the double peaks at the Hγ and the Ne III (3967) emission. B. Garcia-
Lorenzo et al. [304] and other authors suggest here Doppler effects due to differently run-
ning streams of gas in the close vicinity around the black hole.
Seyfert galaxies are divided into:
– Subclass 1 with strongly broadened lines, limited to the permitted transitions
– Subclass 2 with only slightly broadened lines, limited to the permitted transitions
Generally it is now assumed, that this difference in classification is rather caused by effects
of different perspectives, see "Seyfert Unification Theory" [306]. Thus, at subclass 2, the
forming regions of the broad, permitted lines are possibly obscured by dust clouds and/or
an unfavourable viewing angle.
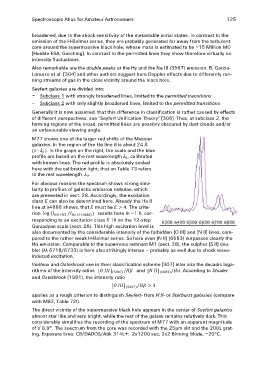
M77 shows one of the larger red shifts of the Messier
galaxies. In the region of the Hα line it is about 24 Å
(ߣ ∙ ݖ). In the graph on the right, the scale and the blue
profile are based on the rest wavelength ߣ, calibrated
with known lines. The red profile is absolutely scaled
here with the calibration light; that on Table 73 refers
to the rest wavelength ߣ.
For obvious reasons the spectrum shows strong simi-
larity to profiles of galactic emission nebulae, which
are presented in sect. 28. Accordingly, the excitation
class ܧcan also be determined here. Already the He II
line at λ4686 shows, that ܧmust be > ܧ4. The crite-
rion log (ܫேଵାேଶ /ܫு ூூ (ସ଼)) results here in ~1.5, cor-
responding to an excitation class ܧ10 on the 12-step
Gurzadyan scale (sect. 28). This high excitation level is
also documented by the considerable intensity of the forbidden [O III] and [N II] lines, com-
pared to the rather weak H-Balmer series. So here even [N II] (6583) surpasses clearly the
Hα emission. Comparable to the supernova remnant M1 (sect. 28), the sulphur [S II] dou-
blet (λλ 6718/6733) is here also strikingly intense – probably as well due to shock wave-
induced excitation.
Veilleux and Osterbrock use in their classification scheme [307] inter alia the decadic loga-
rithms of the intensity ratios [ܱ (]ܫܫܫହ)/ ߚܪand [ܰ (]ܫܫହ଼ଷ)/ߙܪ. According to Shuder
and Osterbrock (1981), the intensity ratio
[ܱ (]ܫܫܫହ)/ > ߚܪ3
applies as a rough criterion to distinguish Seyfert- from H II- or Starburst galaxies (compare
with M82, Table 72!).
The direct vicinity of the supermassive black hole appears in the center of Seyfert galaxies
almost star like and very bright, while the rest of the galaxy remains relatively dark. This
considerably simplifies the recording of the spectrum of M77 with an apparent magnitude
of V 8.9m. The spectrum from the core was recorded with the 25μm slit and the 200L grat-
ing. Exposure time: C8/DADOS/Atik 314L+: 2x1200 sec, 2x2 Binning Mode, –20°C.