
Page 171 - Applied Statistics with R
P. 171
9.3. SIGNIFICANCE OF REGRESSION 171
The interpretation changes slightly as compared to SLR. In this MLR case, we
say that 80.82% for the observed variation in miles per gallon is explained by
the linear relationship with the two predictor variables, weight and year.
In multiple regression, the significance of regression test is
∶ = = ⋯ = −1 = 0.
0
2
1
Here, we see that the null hypothesis sets all of the equal to 0, except the
intercept, . We could then say that the null model, or “model under the null
0
hypothesis” is
= + .
0
This is a model where the regression is insignificant. None of the predictors
have a significant linear relationship with the response. Notationally, we will
denote the fitted values of this model as ̂ , which in this case happens to be:
0
̂ = ̄.
0
The alternative hypothesis here is that at least one of the from the null
hypothesis is not 0.
∶ At least one of ≠ 0, = 1, 2, ⋯ , ( − 1)
1
We could then say that the full model, or “model under the alternative hypoth-
esis” is
= + + + ⋯ + ( −1) ( −1) +
2 2
1 1
0
This is a model where the regression is significant. At least one of the predic-
tors has a significant linear relationship with the response. There is some linear
relationship between and the predictors, , , … , −1 .
1
2
We will denote the fitted values of this model as ̂ .
1
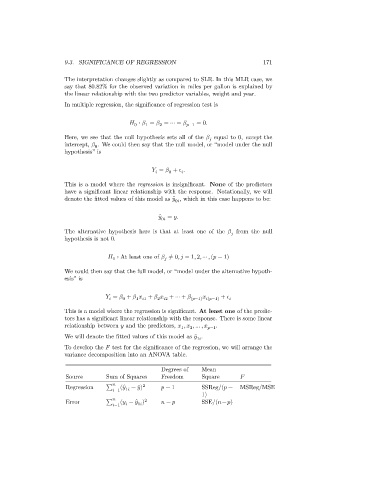
To develop the test for the significance of the regression, we will arrange the
variance decomposition into an ANOVA table.
Degrees of Mean
Source Sum of Squares Freedom Square
2
Regression ∑ ( ̂ − ̄) − 1 SSReg/( − MSReg/MSE
=1 1
1)
Error ∑ ( − ̂ ) 2 − SSE/( − )
=1 1 