Page 240 - Applied Statistics with R
P. 240

240                          CHAPTER 12. ANALYSIS OF VARIANCE


                                    •    = 16.4879492
                                    • p-value = 2.2378806 × 10 −6


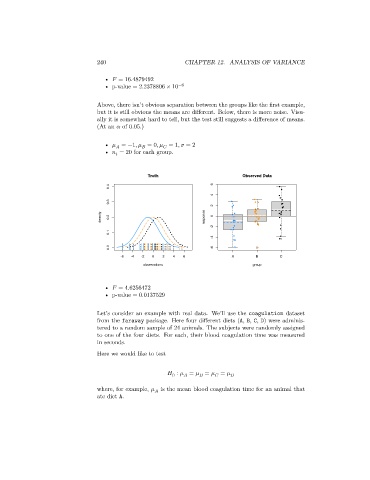
                                 Above, there isn’t obvious separation between the groups like the first example,
                                 but it is still obvious the means are different. Below, there is more noise. Visu-
                                 ally it is somewhat hard to tell, but the test still suggests a difference of means.
                                 (At an    of 0.05.)

                                    •    = −1,    = 0,    = 1,    = 2


                                    •    = 20 for each group.
                                         
                                                  Truth                          Observed Data
                                     0.4                               6
                                                                       4
                                     0.3
                                                                       2
                                  density  0.2                       response  0
                                                                       -2
                                     0.1
                                                                       -4
                                     0.0                               -6
                                         -6  -4  -2  0  2  4  6               A       B       C
                                                observations                         group


                                    •    = 4.6256472
                                    • p-value = 0.0137529


                                 Let’s consider an example with real data. We’ll use the coagulation dataset
                                 from the faraway package. Here four different diets (A, B, C, D) were adminis-
                                 tered to a random sample of 24 animals. The subjects were randomly assigned
                                 to one of the four diets. For each, their blood coagulation time was measured
                                 in seconds.
                                 Here we would like to test


                                                           ∶    =    =    =      
                                                                          
                                                                     
                                                          0
                                                                
                                 where, for example,    is the mean blood coagulation time for an animal that
                                                      
                                 ate diet A.
   235   236   237   238   239   240   241   242   243   244   245