
Page 241 - Applied Statistics with R
P. 241
12.3. ONE-WAY ANOVA 241
library(faraway)
names(coagulation)
## [1] "coag" "diet"
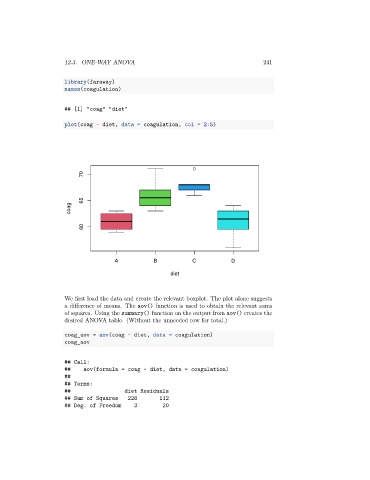
plot(coag ~ diet, data = coagulation, col = 2:5)
70
65
coag
60
A B C D
diet
We first load the data and create the relevant boxplot. The plot alone suggests
a difference of means. The aov() function is used to obtain the relevant sums
of squares. Using the summary() function on the output from aov() creates the
desired ANOVA table. (Without the unneeded row for total.)
coag_aov = aov(coag ~ diet, data = coagulation)
coag_aov
## Call:
## aov(formula = coag ~ diet, data = coagulation)
##
## Terms:
## diet Residuals
## Sum of Squares 228 112
## Deg. of Freedom 3 20