
Page 239 - Applied Statistics with R
P. 239
12.3. ONE-WAY ANOVA 239
Truth Observed Data
0.4
3
0.3 2
density 0.2 response 1 0
0.1 -1
-2
0.0
-3 -2 -1 0 1 2 3 A B C
observations group
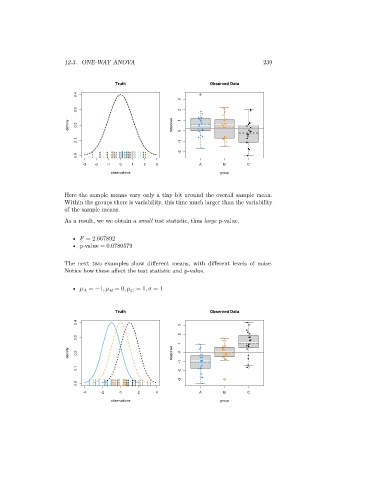
Here the sample means vary only a tiny bit around the overall sample mean.
Within the groups there is variability, this time much larger than the variability
of the sample means.
As a result, we we obtain a small test statistic, thus large p-value.
• = 2.667892
• p-value = 0.0780579
The next two examples show different means, with different levels of noise.
Notice how these affect the test statistic and p-value.
• = −1, = 0, = 1, = 1
Truth Observed Data
0.4
3
2
0.3
1
density 0.2 response 0
-1
0.1 -2
-3
0.0
-4 -2 0 2 4 A B C
observations group