
Page 244 - Applied Statistics with R
P. 244
244 CHAPTER 12. ANALYSIS OF VARIANCE
# return f_stat if stat = TRUE, otherwise, p-value
ifelse(stat, f_stat, p_val)
}
f_stats = replicate(n = 5000, sim_anova(stat = TRUE))
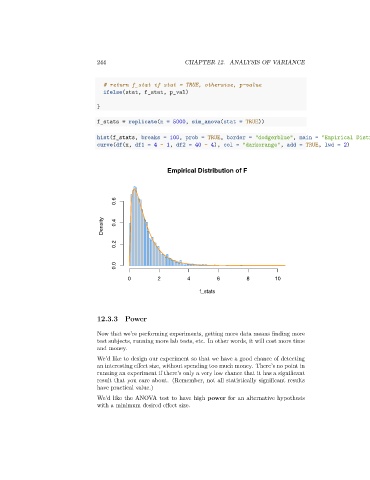
hist(f_stats, breaks = 100, prob = TRUE, border = "dodgerblue", main = "Empirical Distribution of F")
curve(df(x, df1 = 4 - 1, df2 = 40 - 4), col = "darkorange", add = TRUE, lwd = 2)
Empirical Distribution of F
0.6
Density 0.4
0.2
0.0
0 2 4 6 8 10
f_stats
12.3.3 Power
Now that we’re performing experiments, getting more data means finding more
test subjects, running more lab tests, etc. In other words, it will cost more time
and money.
We’d like to design our experiment so that we have a good chance of detecting
an interesting effect size, without spending too much money. There’s no point in
running an experiment if there’s only a very low chance that it has a significant
result that you care about. (Remember, not all statistically significant results
have practical value.)
We’d like the ANOVA test to have high power for an alternative hypothesis
with a minimum desired effect size.