
Page 245 - Applied Statistics with R
P. 245
12.3. ONE-WAY ANOVA 245
Power = (Reject ∣ False)
0
0
That is, for a true difference of means that we deem interesting, we want the
test to reject with high probability.
A number of things can affect the power of a test:
• Effect size. It is easier to detect larger effects.
• Noise level . The less noise, the easier it is to detect signal (effect). We
don’t have much ability to control this, except maybe to measure more
accurately.
• Significance level . Lower significance level makes rejecting more dif-
ficult. (But also allows for less false positives.)
• Sample size. Large samples means easier to detect effects.
• Balanced design. An equal number of observations per group leads to
higher power.
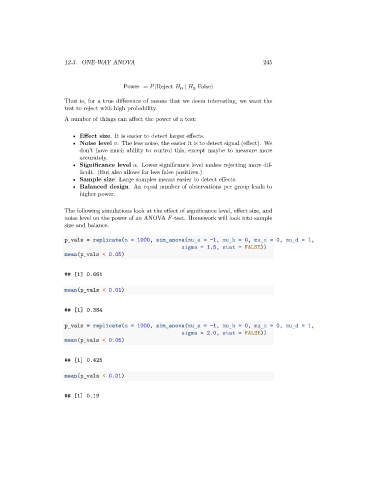
The following simulations look at the effect of significance level, effect size, and
noise level on the power of an ANOVA -test. Homework will look into sample
size and balance.
p_vals = replicate(n = 1000, sim_anova(mu_a = -1, mu_b = 0, mu_c = 0, mu_d = 1,
sigma = 1.5, stat = FALSE))
mean(p_vals < 0.05)
## [1] 0.661
mean(p_vals < 0.01)
## [1] 0.384
p_vals = replicate(n = 1000, sim_anova(mu_a = -1, mu_b = 0, mu_c = 0, mu_d = 1,
sigma = 2.0, stat = FALSE))
mean(p_vals < 0.05)
## [1] 0.425
mean(p_vals < 0.01)
## [1] 0.19