
Page 253 - Applied Statistics with R
P. 253
12.5. TWO-WAY ANOVA 253
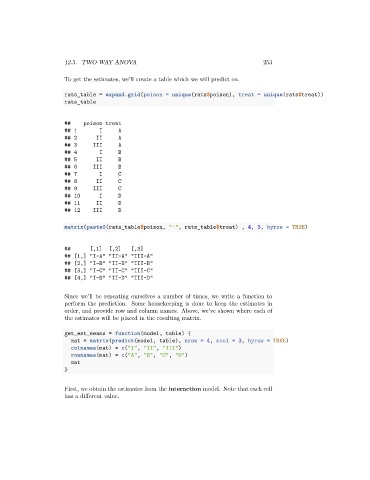
To get the estimates, we’ll create a table which we will predict on.
rats_table = expand.grid(poison = unique(rats$poison), treat = unique(rats$treat))
rats_table
## poison treat
## 1 I A
## 2 II A
## 3 III A
## 4 I B
## 5 II B
## 6 III B
## 7 I C
## 8 II C
## 9 III C
## 10 I D
## 11 II D
## 12 III D
matrix(paste0(rats_table$poison, "-", rats_table$treat) , 4, 3, byrow = TRUE)
## [,1] [,2] [,3]
## [1,] "I-A" "II-A" "III-A"
## [2,] "I-B" "II-B" "III-B"
## [3,] "I-C" "II-C" "III-C"
## [4,] "I-D" "II-D" "III-D"
Since we’ll be repeating ourselves a number of times, we write a function to
perform the prediction. Some housekeeping is done to keep the estimates in
order, and provide row and column names. Above, we’ve shown where each of
the estimates will be placed in the resulting matrix.
get_est_means = function(model, table) {
mat = matrix(predict(model, table), nrow = 4, ncol = 3, byrow = TRUE)
colnames(mat) = c("I", "II", "III")
rownames(mat) = c("A", "B", "C", "D")
mat
}
First, we obtain the estimates from the interaction model. Note that each cell
has a different value.