
Page 249 - Applied Statistics with R
P. 249
12.5. TWO-WAY ANOVA 249
Based on these results, we see no difference between A and D as well as B and
C. All other pairwise comparisons are significant. If you return to the original
boxplot, these results should not be surprising.
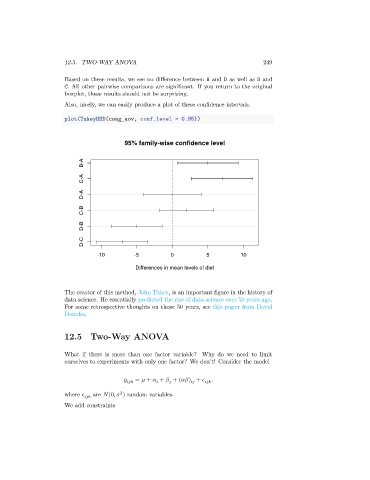
Also, nicely, we can easily produce a plot of these confidence intervals.
plot(TukeyHSD(coag_aov, conf.level = 0.95))
95% family-wise confidence level
B-A
C-A
D-A
C-B
D-B
D-C
-10 -5 0 5 10
Differences in mean levels of diet
The creator of this method, John Tukey, is an important figure in the history of
data science. He essentially predicted the rise of data science over 50 years ago.
For some retrospective thoughts on those 50 years, see this paper from David
Donoho.
12.5 Two-Way ANOVA
What if there is more than one factor variable? Why do we need to limit
ourselves to experiments with only one factor? We don’t! Consider the model
= + + + ( ) + .
2
where are (0, ) random variables.
We add constraints