
Page 140 - APPLIED PROCESS DESIGN FOR CHEMICAL AND PETROCHEMICAL PLANTS, Volume 1, 3rd Edition
P. 140
124 Applied Process Design for Chemical and Petrochemical Plants
Parallel System: New Capa<:ity after Paralleling If two-phase flow situations are not recognized, pres-
sure drop problems may develop which can prevent sys-
Solve this relation, rearranged conveniently to [ 43): tems from operating. It requires very little percentage of
vapor, generally above 7% to 8%, to establish volumes and
flow velocities that must be solved by two-phase flow analy-
"'" � H-[1-+-( d- b ....;):....d-.--)-2- . 66_7_]_ 2 sis. The discharge flow through a pressure relief valve on
a process reactor is often an important example where
two-phase flow exists, and must be recognized for its back
pressure impact.
Two-phase Liquid and Gas Flow
Flow Patterns
The concurrent flow of liquid and gas in pipe lines has
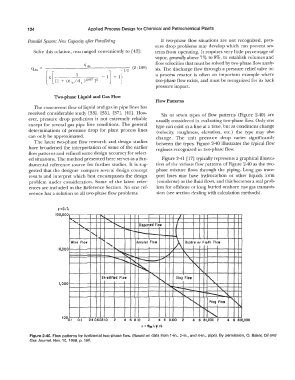
received considerable study [33), [35], [37], [ 41]. How- Six or seven types of flow patterns (Figure 2-40) are
ever, pressure drop prediction is not extremely reliable usually considered in evaluating two-phase flow. Only one
except for several gas pipe line conditions. The general type can exist in a line at a time, but as conditions change
determinations of pressure drop for plant process lines (velocity, roughness, elevation, etc.) the type may also
can only be approximated. change. The unit pressure drop varies significantly
The latest two-phase flow research and design studies between the types. Figure 2-40 illustrates the typical flow
have broadened the interpretation of some of the earlier regimes recognized in two-phase flow.
flow patterns and refined some design accuracy for select-
ed situations. The method presented here serves as a fun- Figure 2-41 [17] typically represents a graphical illustra-
damental reference source for further studies. It is sug- tion of the various flow patterns of Figure 2-40 as the two-
gested that the designer compare several design concept phase mixture flows through the piping. Long gas trans-
results and interpret which best encompasses the design port lines may have hydrocarbon or other liquids form
problem under consideration. Some of the latest refer- (condense) as the fluid flows, and this becomes a real prob-
ences are included in the Reference Section. No one ref- lem for offshore or long buried onshore raw gas transmis-
erence has a solution to all two-phase flow problems. sion (see section dealing with calculation methods).
y=G/X
100,000 I I I
......... " ........... , I
....
-, ............. Dispersed Flow
.......... ......_
1, . -- - ..... I
:-...
Wave Flow Annular Flow A Bubble or Froth Flow
10,000 '· ........... 1 ...
.... � � -- I,.,; "" '\..
---..... .... .... L_.
""'""' � .. " � �
<, r-.
Stratified Flow i"-.. Slug Flow
�-
1,000 ....
----
'
............ ""'i--- � '
<, Plug Flow '�
' n-. ...
I
1000.1 0.2 0.4 0.60.81.0 2 4 6 8 10 2 4 6 8 100 2 4 6 B 1,000 2 4 6 810,000
x = WmXy,/G
Figure 2-40. Flow patterns for horizontal two-phase flow. (Based on data from 1-in., 2-in., and 4-in., pipe). By permission, 0. Baker, Oil and
Gas Journal, Nov. 10, 1958, p. 156.