
Page 142 - APPLIED PROCESS DESIGN FOR CHEMICAL AND PETROCHEMICAL PLANTS, Volume 1, 3rd Edition
P. 142
126 Applied Process Design for Chemical and Petrochemical Plants
3. Calculate value times 1.1 to 2.0, depending upon critical
nature of application.
(2-114)
(2-118)
4. Calculate e for types of flow selected from Figure
2-40 [33].
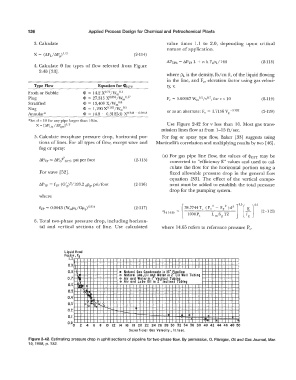
where PL is the density, lb/ cu ft, of the liquid flowing
in the line, and Fe, elevation factor using gas veloci-
Type Flow Equation for 4>GTT ty, v.
Froth or Bubble <I>= 14.2 xo.75/WmO.l
x
Plug cf>= 27.315 0·855/Wmo.17 (2-ll9)
Stratified cf> = 15,400 X/V. 1m0·8
Slug ¢ = 1,190 xo.1s,,;wmo.5 or as an alternate: F = 1. 7156 -o.102 (2-120)
0
Annular+ <I> = (4.8 - 0.3125d) X0.348 - 0.02Id Vg
*Set d = 10 for any pipe larger than 10-in.
X = [LlPL;q/ LlP ga,] V 2 Use Figure 2-42 for v less than 10. Most gas trans-
mission lines flow at from 1-15 ft/sec.
5. Calculate two-phase pressure drop, horizontal por- For fog or spray type flow, Baker [33] suggests using
tions of lines. For all types of flow, except wave and Martinell i's correlation and multiplying results by two [ 46].
fog or spray:
(a) For gas pipe line flow, the values of <l>crr may be
�PTP = �pc$2 err, psi per foot (2-115) converted to "efficiency E" values and used to cal-
culate the flow for the horizontal portion using a
For wave [52]. fixed allowable pressure drop in the general flow
equation [33]. The effect of the vertical compo-
�P'lr = fTP (G'g)2 /193.2 dPg, psi/foot (2-116) nent must be added to establish the total pressure
drop for the pumping system.
where
(2-117) = [38.7744T, (P/ - P/ )d 5 ]0'5
( -
14 65
f
qd ' lOOOP L S TZ (..£)o.s 2 121 )
s m g S
6. Total two-phase pressure drop, including horizon-
tal and vertical sections of line. Use calculated where 14.65 refers to reference pressure P 5•
Liquid Head
Factor, Fe
1.0 T l T, I I I I II II I I I I I !
0.9 I 'r T I Tl, I I I I I I I I I I I I ) I
I I I I
I 11 11 I
I
I
I I
I I
0.8 \ • Natural Gos Condensate in 16" f!i11eline
0.7 , o Natural Gos,Oil and Water in 2 011 Well Tubing
e Air and Water in I" Ver;.tical Tubing
o Air and Lube Oil in 2 Inclined Tubing
0.6
'
..
0.5 ..... r •
0.4
0.3
·� In �
0.2 ..... _ c
0.1 • ' b
.
I"'
0·0 o 2 4 6 8 10 12 14 16 18 20 22 24 26 28 30 32 34 36 38 40 42 44 46 48 50
Superficial Gos Velocity, fl./sec.
Figure 2-42. Estimating pressure drop in uphill sections of pipeline for two-phase flow. By permission, 0. Flanigan, Oil and Gas Journal, Mar.
10, 1958, p. 132.