
Page 388 - APPLIED PROCESS DESIGN FOR CHEMICAL AND PETROCHEMICAL PLANTS, Volume 1, 3rd Edition
P. 388
356 Applied Process Design for Chemical and Petrochemical Plants
IOOOir-- � A � t m_o_s � p h-e � r ic--=P- r e- s s-u- r e-- � ----T---- � --.,-- ����� --,
lY�iWM
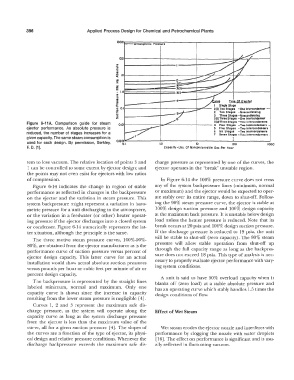
I Slnvle stooe -
2(1) Two Stao11 -One lntercondenser
2 Two Staoes -Noncondenslno
3 Three Staoes - Noncondenslno
6 3(1) Three Staoes -One lntercondenser
3(2)Three Staoes -Two lntercondenaere
Figure 6-11A. Comparison guide for steam 1---------:l.a.,..,_�-----+---- 4 Four Staoes -Two lntercondensers
ejector performance. As absolute pressure is 5 Five Staoes -Two lntercondensers
reduced, the number of stages increases for a 6 Six Staoes -Two lntercondensers
7 Seven Stoots -Two lntercondensers
given capacity. The same steam consumption is
used for each design. By permission, Berkley, 1.0 10 100 1000
F. D. [1]. Capacity-Lbs. Of Noncondcnsable Gas Per Hour
tern lo lose vacuum. The relative location of points 3 and charge pressure as represented by one of the curves, the
1 can be controlled to some extent by ejector design; and ejector operates in the "break" unstable region.
the points may not even exist for ejectors with low ratios
of compression. In Figure 6-14 the 100% pressure curve does not cross
Figure 6-14 indicates the change in region of stable any of the system backpressure lines (minimum, normal
performance as reflected in changes in the backpressure or maximum) and the ejector would be expected to oper-
on the ejector and the variation in steam pressure. This ate stably over its entire range, down to shut-off. Follow-
system backpressure might represent a variation in baro- ing the 90% steam pressure curve, the ejector is stable at
metric pressure for a unit discharging to the atmosphere, 100% design suction pressure and 100% design capacity
or the variation in a feedwater (or other) heater operat- al the maximum back pressure. It is unstable below design
ing pressure if the ejector discharges into a closed system load unless the heater pressure is reduced. Note that its
or condenser. Figure 6-14 numerically represents the lat- break occurs at 20 psia and 100% design suction pressure.
ter situation, although the principle is the same. If the discharge pressure is reduced to 19 psia, the unit
The three motive steam pressure curves, 100%-90%- will be stable to shut-off (zero capacity). The 80% steam
80%, are obtained from the ejector manufacturer as is the pressure will allow stable operation from shut-off up
performance curve of suction pressure versus percent of through the full capacity range as long as the backpres-
ejector design capacity. This latter curve for an actual sure does not exceed 18 psia. This type of analysis is nec-
installation would show actual absolute suction pressures essary to properly evaluate ejector performance with vary-
versus pounds per hour or cubic feet per minute of air or ing system conditions.
percent design capacity.
A unit is said to have 50% overload capacity when it
The backpressure is represented by the straight lines blanks off (zero load) at a stable absolute pressure and
labeled minimum, normal and maximum. Only one has an operating curve which stably handles 1.5 times the
capacity curve is shown since the increase in capacity design conditions of flow.
resulting from the lower steam pressure is negligible [ 4].
Curves 1, 2 and 3 represent the maximum safe dis-
charge pressure, as the system will operate along the Effect of Wet Steam
capacity curve as long as the system discharge pressure
from the ejector is less than the maximum value of the
curve, all for a given suction pressure [ 4]. The slopes of v\Tet steam erodes the ejector nozzle and interferes with
the curves are a function of the type of ejector, its physi- performance by clogging the nozzle with water droplets
cal design and relative pressure conditions. ·whenever the [16]. The effect on performance is significant and is usu-
discharge backpressure exceeds the maximum safe dis- ally reflected in fluctuating vacuum.