
Page 185 - Python Data Science Handbook
P. 185
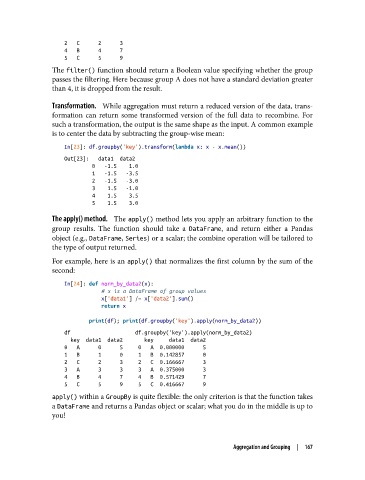
2   C      2      3
                   4   B      4      7
                   5   C      5      9
               The filter() function should return a Boolean value specifying whether the group
               passes the filtering. Here because group A does not have a standard deviation greater
               than 4, it is dropped from the result.

               Transformation.    While aggregation must return a reduced version of the data, trans‐
               formation can return some transformed version of the full data to recombine. For
               such a transformation, the output is the same shape as the input. A common example
               is to center the data by subtracting the group-wise mean:

                   In[23]: df.groupby('key').transform(lambda x: x - x.mean())
                   Out[23]:   data1  data2
                            0   -1.5    1.0
                            1   -1.5   -3.5
                            2   -1.5   -3.0
                            3    1.5   -1.0
                            4    1.5    3.5
                            5    1.5    3.0

               The apply() method.    The apply() method lets you apply an arbitrary function to the
               group results. The function should take a DataFrame, and return either a Pandas
               object (e.g., DataFrame, Series) or a scalar; the combine operation will be tailored to
               the type of output returned.
               For example, here is an apply() that normalizes the first column by the sum of the
               second:
                   In[24]: def norm_by_data2(x):
                               # x is a DataFrame of group values
                               x['data1'] /= x['data2'].sum()
                               return x

                           print(df); print(df.groupby('key').apply(norm_by_data2))
                   df                     df.groupby('key').apply(norm_by_data2)
                     key  data1  data2       key     data1  data2
                   0   A      0      5     0   A  0.000000      5
                   1   B      1      0     1   B  0.142857      0
                   2   C      2      3     2   C  0.166667      3
                   3   A      3      3     3   A  0.375000      3
                   4   B      4      7     4   B  0.571429      7
                   5   C      5      9     5   C  0.416667      9
               apply() within a GroupBy is quite flexible: the only criterion is that the function takes
               a DataFrame and returns a Pandas object or scalar; what you do in the middle is up to
               you!


                                                                 Aggregation and Grouping  |  167