
Page 187 - Python Data Science Handbook
P. 187
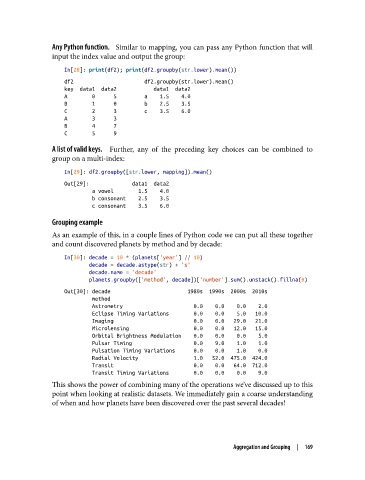
Any Python function.    Similar to mapping, you can pass any Python function that will
               input the index value and output the group:

                   In[28]: print(df2); print(df2.groupby(str.lower).mean())
                   df2                       df2.groupby(str.lower).mean()
                   key  data1  data2            data1  data2
                   A        0      5         a    1.5    4.0
                   B        1      0         b    2.5    3.5
                   C        2      3         c    3.5    6.0
                   A        3      3
                   B        4      7
                   C        5      9

               A list of valid keys.     Further, any of the preceding key choices can be combined to
               group on a multi-index:

                   In[29]: df2.groupby([str.lower, mapping]).mean()
                   Out[29]:              data1  data2
                            a vowel        1.5    4.0
                            b consonant    2.5    3.5
                            c consonant    3.5    6.0
               Grouping example

               As an example of this, in a couple lines of Python code we can put all these together
               and count discovered planets by method and by decade:

                   In[30]: decade = 10 * (planets['year'] // 10)
                           decade = decade.astype(str) + 's'
                           decade.name = 'decade'
                           planets.groupby(['method', decade])['number'].sum().unstack().fillna(0)
                   Out[30]: decade                         1980s  1990s  2000s  2010s
                            method
                            Astrometry                       0.0    0.0    0.0    2.0
                            Eclipse Timing Variations        0.0    0.0    5.0   10.0
                            Imaging                          0.0    0.0   29.0   21.0
                            Microlensing                     0.0    0.0   12.0   15.0
                            Orbital Brightness Modulation    0.0    0.0    0.0    5.0
                            Pulsar Timing                    0.0    9.0    1.0    1.0
                            Pulsation Timing Variations      0.0    0.0    1.0    0.0
                            Radial Velocity                  1.0   52.0  475.0  424.0
                            Transit                          0.0    0.0   64.0  712.0
                            Transit Timing Variations        0.0    0.0    0.0    9.0
               This shows the power of combining many of the operations we’ve discussed up to this
               point when looking at realistic datasets. We immediately gain a coarse understanding
               of when and how planets have been discovered over the past several decades!


                                                                 Aggregation and Grouping  |  169