
Page 218 - Python Data Science Handbook
P. 218
ax[1].legend(['shift(900)'], loc=2)
ax[1].get_xticklabels()[4].set(weight='heavy', color='red')
ax[1].axvline(local_max + offset, alpha=0.3, color='red')
ax[2].legend(['tshift(900)'], loc=2)
ax[2].get_xticklabels()[1].set(weight='heavy', color='red')
ax[2].axvline(local_max + offset, alpha=0.3, color='red');
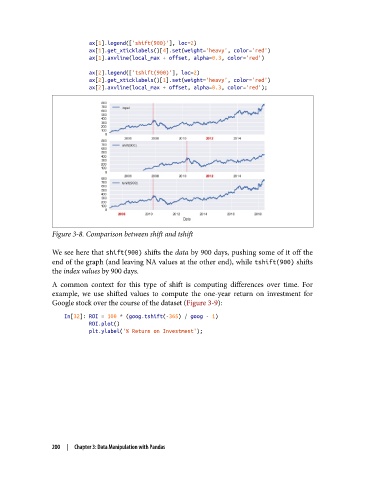
Figure 3-8. Comparison between shift and tshift
We see here that shift(900) shifts the data by 900 days, pushing some of it off the
end of the graph (and leaving NA values at the other end), while tshift(900) shifts
the index values by 900 days.
A common context for this type of shift is computing differences over time. For
example, we use shifted values to compute the one-year return on investment for
Google stock over the course of the dataset (Figure 3-9):
In[32]: ROI = 100 * (goog.tshift(-365) / goog - 1)
ROI.plot()
plt.ylabel('% Return on Investment');
200 | Chapter 3: Data Manipulation with Pandas