
Page 219 - Python Data Science Handbook
P. 219
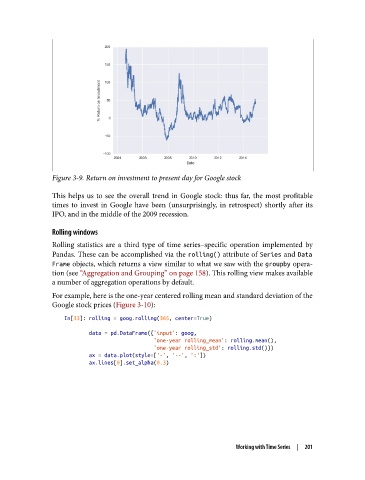
Figure 3-9. Return on investment to present day for Google stock

               This helps us to see the overall trend in Google stock: thus far, the most profitable
               times to invest in Google have been (unsurprisingly, in retrospect) shortly after its
               IPO, and in the middle of the 2009 recession.

               Rolling windows
               Rolling statistics are a third type of time series–specific operation implemented by
               Pandas. These can be accomplished via the rolling() attribute of Series and Data
               Frame objects, which returns a view similar to what we saw with the groupby opera‐
               tion (see “Aggregation and Grouping” on page 158). This rolling view makes available
               a number of aggregation operations by default.
               For example, here is the one-year centered rolling mean and standard deviation of the
               Google stock prices (Figure 3-10):
                   In[33]: rolling = goog.rolling(365, center=True)

                           data = pd.DataFrame({'input': goog,
                                                'one-year rolling_mean': rolling.mean(),
                                                'one-year rolling_std': rolling.std()})
                           ax = data.plot(style=['-', '--', ':'])
                           ax.lines[0].set_alpha(0.3)


                                                                  Working with Time Series  |  201