
Page 221 - Python Data Science Handbook
P. 221
In[34]:
# !curl -o FremontBridge.csv
# https://data.seattle.gov/api/views/65db-xm6k/rows.csv?accessType=DOWNLOAD
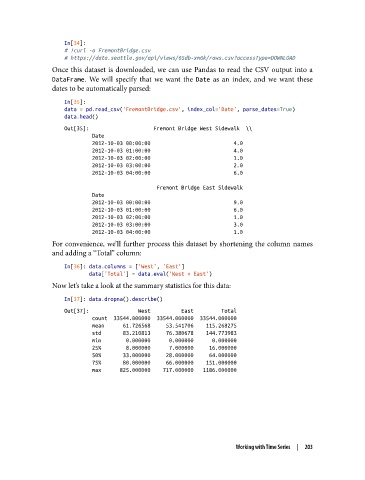
Once this dataset is downloaded, we can use Pandas to read the CSV output into a
DataFrame. We will specify that we want the Date as an index, and we want these
dates to be automatically parsed:
In[35]:
data = pd.read_csv('FremontBridge.csv', index_col='Date', parse_dates=True)
data.head()
Out[35]: Fremont Bridge West Sidewalk \\
Date
2012-10-03 00:00:00 4.0
2012-10-03 01:00:00 4.0
2012-10-03 02:00:00 1.0
2012-10-03 03:00:00 2.0
2012-10-03 04:00:00 6.0
Fremont Bridge East Sidewalk
Date
2012-10-03 00:00:00 9.0
2012-10-03 01:00:00 6.0
2012-10-03 02:00:00 1.0
2012-10-03 03:00:00 3.0
2012-10-03 04:00:00 1.0
For convenience, we’ll further process this dataset by shortening the column names
and adding a “Total” column:
In[36]: data.columns = ['West', 'East']
data['Total'] = data.eval('West + East')
Now let’s take a look at the summary statistics for this data:
In[37]: data.dropna().describe()
Out[37]: West East Total
count 33544.000000 33544.000000 33544.000000
mean 61.726568 53.541706 115.268275
std 83.210813 76.380678 144.773983
min 0.000000 0.000000 0.000000
25% 8.000000 7.000000 16.000000
50% 33.000000 28.000000 64.000000
75% 80.000000 66.000000 151.000000
max 825.000000 717.000000 1186.000000
Working with Time Series | 203