
Page 223 - Python Data Science Handbook
P. 223
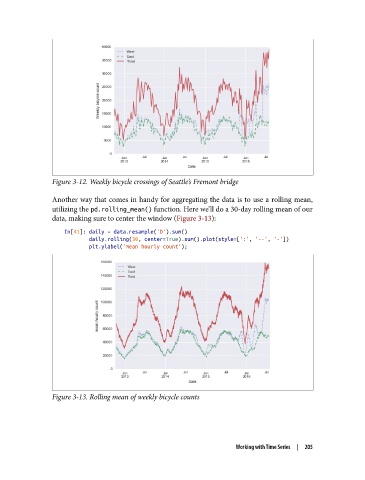
Figure 3-12. Weekly bicycle crossings of Seattle’s Fremont bridge


               Another way that comes in handy for aggregating the data is to use a rolling mean,
               utilizing the pd.rolling_mean() function. Here we’ll do a 30-day rolling mean of our
               data, making sure to center the window (Figure 3-13):
                   In[41]: daily = data.resample('D').sum()
                           daily.rolling(30, center=True).sum().plot(style=[':', '--', '-'])
                           plt.ylabel('mean hourly count');


               Figure 3-13. Rolling mean of weekly bicycle counts


                                                                  Working with Time Series  |  205