
Page 220 - Python Data Science Handbook
P. 220
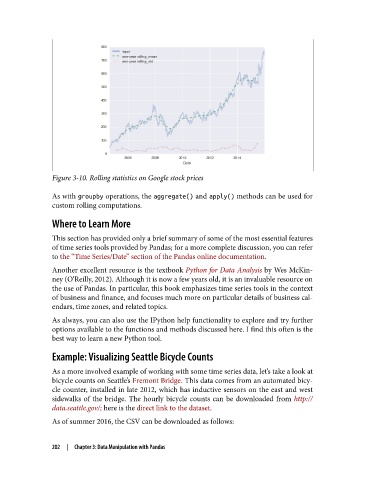
Figure 3-10. Rolling statistics on Google stock prices

               As with groupby operations, the aggregate() and apply() methods can be used for
               custom rolling computations.

               Where to Learn More

               This section has provided only a brief summary of some of the most essential features
               of time series tools provided by Pandas; for a more complete discussion, you can refer
               to the “Time Series/Date” section of the Pandas online documentation.

               Another excellent resource is the textbook Python for Data Analysis by Wes McKin‐
               ney (O’Reilly, 2012). Although it is now a few years old, it is an invaluable resource on
               the use of Pandas. In particular, this book emphasizes time series tools in the context
               of business and finance, and focuses much more on particular details of business cal‐
               endars, time zones, and related topics.
               As always, you can also use the IPython help functionality to explore and try further
               options available to the functions and methods discussed here. I find this often is the
               best way to learn a new Python tool.

               Example: Visualizing Seattle Bicycle Counts

               As a more involved example of working with some time series data, let’s take a look at
               bicycle counts on Seattle’s Fremont Bridge. This data comes from an automated bicy‐
               cle counter, installed in late 2012, which has inductive sensors on the east and west
               sidewalks of the bridge. The hourly bicycle counts can be downloaded from http://
               data.seattle.gov/; here is the direct link to the dataset.

               As of summer 2016, the CSV can be downloaded as follows:


               202  |  Chapter 3: Data Manipulation with Pandas