
Page 305 - Python Data Science Handbook
P. 305
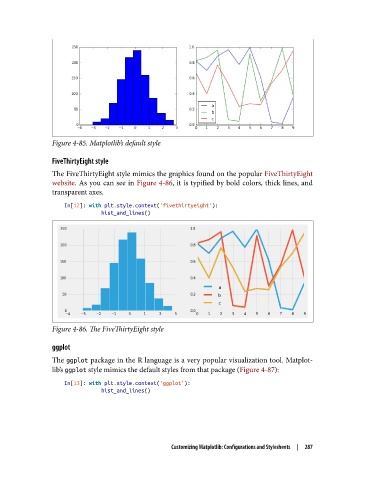
Figure 4-85. Matplotlib’s default style

               FiveThirtyEight style
               The FiveThirtyEight style mimics the graphics found on the popular FiveThirtyEight
               website. As you can see in Figure 4-86, it is typified by bold colors, thick lines, and
               transparent axes.

                   In[12]: with plt.style.context('fivethirtyeight'):
                               hist_and_lines()


               Figure 4-86. The FiveThirtyEight style

               ggplot
               The ggplot package in the R language is a very popular visualization tool. Matplot‐
               lib’s ggplot style mimics the default styles from that package (Figure 4-87):
                   In[13]: with plt.style.context('ggplot'):
                               hist_and_lines()


                                                Customizing Matplotlib: Configurations and Stylesheets  |  287