
Page 308 - Python Data Science Handbook
P. 308
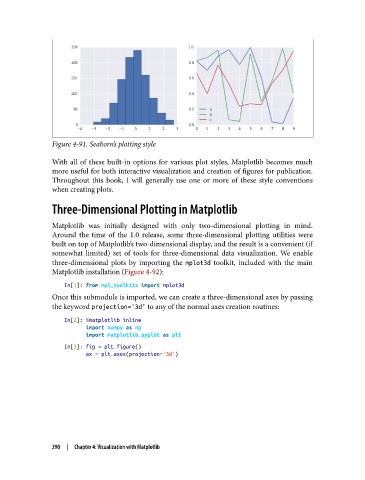
Figure 4-91. Seaborn’s plotting style

               With all of these built-in options for various plot styles, Matplotlib becomes much
               more useful for both interactive visualization and creation of figures for publication.
               Throughout this book, I will generally use one or more of these style conventions
               when creating plots.

               Three-Dimensional Plotting in Matplotlib

               Matplotlib was initially designed with only two-dimensional plotting in mind.
               Around the time of the 1.0 release, some three-dimensional plotting utilities were
               built on top of Matplotlib’s two-dimensional display, and the result is a convenient (if
               somewhat limited) set of tools for three-dimensional data visualization. We enable
               three-dimensional plots by importing the mplot3d  toolkit, included with the main
               Matplotlib installation (Figure 4-92):

                   In[1]: from mpl_toolkits import mplot3d
               Once this submodule is imported, we can create a three-dimensional axes by passing
               the keyword projection='3d' to any of the normal axes creation routines:

                   In[2]: %matplotlib inline
                          import numpy as np
                          import matplotlib.pyplot as plt
                   In[3]: fig = plt.figure()
                          ax = plt.axes(projection='3d')


               290  |  Chapter 4: Visualization with Matplotlib