
Page 303 - Python Data Science Handbook
P. 303
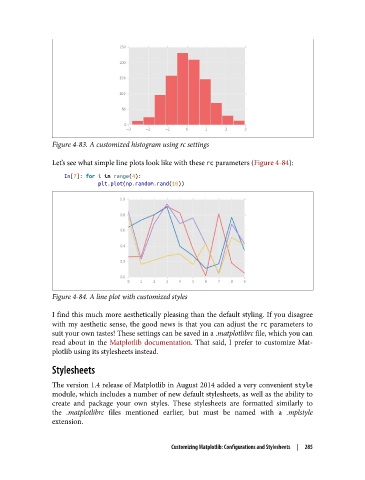
Figure 4-83. A customized histogram using rc settings

               Let’s see what simple line plots look like with these rc parameters (Figure 4-84):

                   In[7]: for i in range(4):
                              plt.plot(np.random.rand(10))


               Figure 4-84. A line plot with customized styles

               I find this much more aesthetically pleasing than the default styling. If you disagree
               with my aesthetic sense, the good news is that you can adjust the rc  parameters to
               suit your own tastes! These settings can be saved in a .matplotlibrc file, which you can
               read about in the Matplotlib documentation. That said, I prefer to customize Mat‐
               plotlib using its stylesheets instead.
               Stylesheets


               The version 1.4 release of Matplotlib in August 2014 added a very convenient style
               module, which includes a number of new default stylesheets, as well as the ability to
               create and package your own styles. These stylesheets are formatted similarly to
               the .matplotlibrc  files mentioned earlier, but must be named with a .mplstyle
               extension.


                                                Customizing Matplotlib: Configurations and Stylesheets  |  285