
Page 307 - Python Data Science Handbook
P. 307
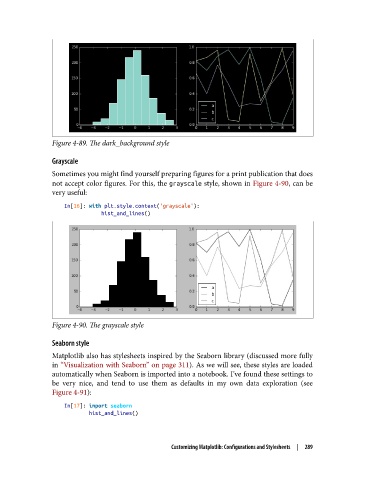
Figure 4-89. The dark_background style

               Grayscale
               Sometimes you might find yourself preparing figures for a print publication that does
               not accept color figures. For this, the grayscale style, shown in Figure 4-90, can be
               very useful:

                   In[16]: with plt.style.context('grayscale'):
                               hist_and_lines()


               Figure 4-90. The grayscale style

               Seaborn style
               Matplotlib also has stylesheets inspired by the Seaborn library (discussed more fully
               in “Visualization with Seaborn” on page 311). As we will see, these styles are loaded
               automatically when Seaborn is imported into a notebook. I’ve found these settings to
               be very nice, and tend to use them as defaults in my own data exploration (see
               Figure 4-91):
                   In[17]: import seaborn
                           hist_and_lines()


                                                Customizing Matplotlib: Configurations and Stylesheets  |  289