
Page 300 - Python Data Science Handbook
P. 300
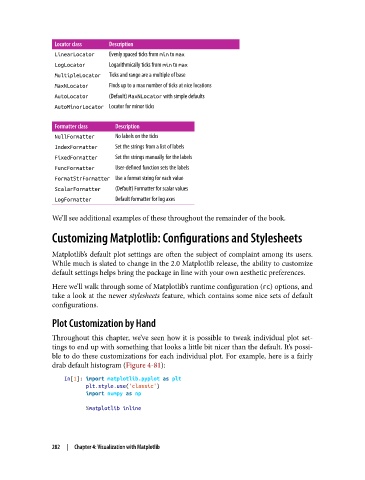
Locator class Description
LinearLocator Evenly spaced ticks from min to max
LogLocator Logarithmically ticks from min to max
MultipleLocator Ticks and range are a multiple of base
MaxNLocator Finds up to a max number of ticks at nice locations
AutoLocator (Default) MaxNLocator with simple defaults
AutoMinorLocator Locator for minor ticks
Formatter class Description
NullFormatter No labels on the ticks
IndexFormatter Set the strings from a list of labels
FixedFormatter Set the strings manually for the labels
FuncFormatter User-dened function sets the labels
FormatStrFormatter Use a format string for each value
ScalarFormatter (Default) Formatter for scalar values
LogFormatter Default formatter for log axes
We’ll see additional examples of these throughout the remainder of the book.
Customizing Matplotlib: Configurations and Stylesheets
Matplotlib’s default plot settings are often the subject of complaint among its users.
While much is slated to change in the 2.0 Matplotlib release, the ability to customize
default settings helps bring the package in line with your own aesthetic preferences.
Here we’ll walk through some of Matplotlib’s runtime configuration (rc) options, and
take a look at the newer stylesheets feature, which contains some nice sets of default
configurations.
Plot Customization by Hand
Throughout this chapter, we’ve seen how it is possible to tweak individual plot set‐
tings to end up with something that looks a little bit nicer than the default. It’s possi‐
ble to do these customizations for each individual plot. For example, here is a fairly
drab default histogram (Figure 4-81):
In[1]: import matplotlib.pyplot as plt
plt.style.use('classic')
import numpy as np
%matplotlib inline
282 | Chapter 4: Visualization with Matplotlib