
Page 312 - Python Data Science Handbook
P. 312
In[8]: fig = plt.figure()
ax = plt.axes(projection='3d')
ax.plot_wireframe(X, Y, Z, color='black')
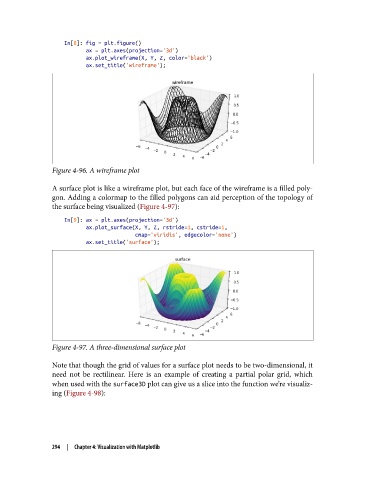
ax.set_title('wireframe');
Figure 4-96. A wireframe plot
A surface plot is like a wireframe plot, but each face of the wireframe is a filled poly‐
gon. Adding a colormap to the filled polygons can aid perception of the topology of
the surface being visualized (Figure 4-97):
In[9]: ax = plt.axes(projection='3d')
ax.plot_surface(X, Y, Z, rstride=1, cstride=1,
cmap='viridis', edgecolor='none')
ax.set_title('surface');
Figure 4-97. A three-dimensional surface plot
Note that though the grid of values for a surface plot needs to be two-dimensional, it
need not be rectilinear. Here is an example of creating a partial polar grid, which
when used with the surface3D plot can give us a slice into the function we’re visualiz‐
ing (Figure 4-98):
294 | Chapter 4: Visualization with Matplotlib