
Page 311 - Python Data Science Handbook
P. 311
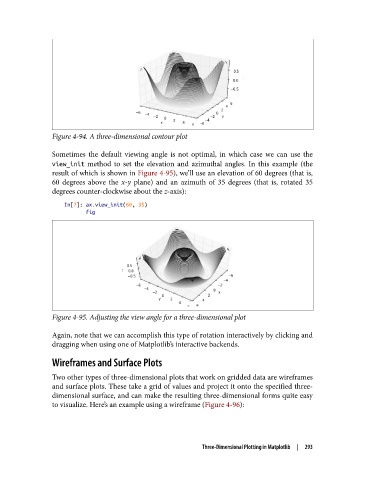
Figure 4-94. A three-dimensional contour plot

               Sometimes the default viewing angle is not optimal, in which case we can use the
               view_init  method to set the elevation and azimuthal angles. In this example (the
               result of which is shown in Figure 4-95), we’ll use an elevation of 60 degrees (that is,
               60 degrees above the x-y  plane) and an azimuth of 35 degrees (that is, rotated 35
               degrees counter-clockwise about the z-axis):

                   In[7]: ax.view_init(60, 35)
                          fig


               Figure 4-95. Adjusting the view angle for a three-dimensional plot

               Again, note that we can accomplish this type of rotation interactively by clicking and
               dragging when using one of Matplotlib’s interactive backends.

               Wireframes and Surface Plots

               Two other types of three-dimensional plots that work on gridded data are wireframes
               and surface plots. These take a grid of values and project it onto the specified three-
               dimensional surface, and can make the resulting three-dimensional forms quite easy
               to visualize. Here’s an example using a wireframe (Figure 4-96):


                                                         Three-Dimensional Plotting in Matplotlib  |  293