
Page 314 - Python Data Science Handbook
P. 314
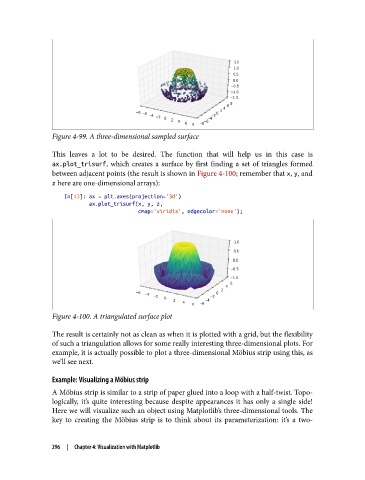
Figure 4-99. A three-dimensional sampled surface

               This leaves a lot to be desired. The function that will help us in this case is
               ax.plot_trisurf, which creates a surface by first finding a set of triangles formed
               between adjacent points (the result is shown in Figure 4-100; remember that x, y, and
               z here are one-dimensional arrays):
                   In[13]: ax = plt.axes(projection='3d')
                           ax.plot_trisurf(x, y, z,
                                           cmap='viridis', edgecolor='none');


               Figure 4-100. A triangulated surface plot

               The result is certainly not as clean as when it is plotted with a grid, but the flexibility
               of such a triangulation allows for some really interesting three-dimensional plots. For
               example, it is actually possible to plot a three-dimensional Möbius strip using this, as
               we’ll see next.

               Example: Visualizing a Möbius strip

               A Möbius strip is similar to a strip of paper glued into a loop with a half-twist. Topo‐
               logically, it’s quite interesting because despite appearances it has only a single side!
               Here we will visualize such an object using Matplotlib’s three-dimensional tools. The
               key to creating the Möbius strip is to think about its parameterization: it’s a two-


               296  |  Chapter 4: Visualization with Matplotlib