
Page 352 - Python Data Science Handbook
P. 352
Here we have two-dimensional data; that is, we have two features for each point, rep‐
resented by the (x,y) positions of the points on the plane. In addition, we have one of
two class labels for each point, here represented by the colors of the points. From
these features and labels, we would like to create a model that will let us decide
whether a new point should be labeled “blue” or “red.”
There are a number of possible models for such a classification task, but here we will
use an extremely simple one. We will make the assumption that the two groups can
be separated by drawing a straight line through the plane between them, such that
points on each side of the line fall in the same group. Here the model is a quantitative
version of the statement “a straight line separates the classes,” while the model param‐
eters are the particular numbers describing the location and orientation of that line
for our data. The optimal values for these model parameters are learned from the
data (this is the “learning” in machine learning), which is often called training the
model.
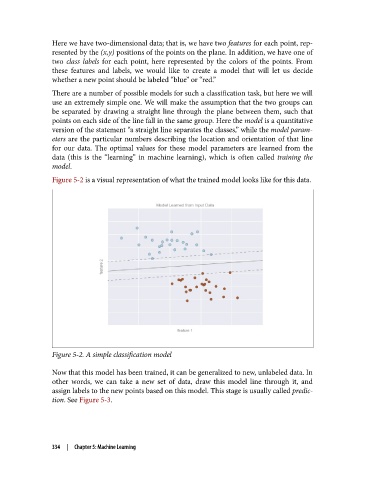
Figure 5-2 is a visual representation of what the trained model looks like for this data.
Figure 5-2. A simple classification model
Now that this model has been trained, it can be generalized to new, unlabeled data. In
other words, we can take a new set of data, draw this model line through it, and
assign labels to the new points based on this model. This stage is usually called predic‐
tion. See Figure 5-3.
334 | Chapter 5: Machine Learning