
Page 355 - Python Data Science Handbook
P. 355
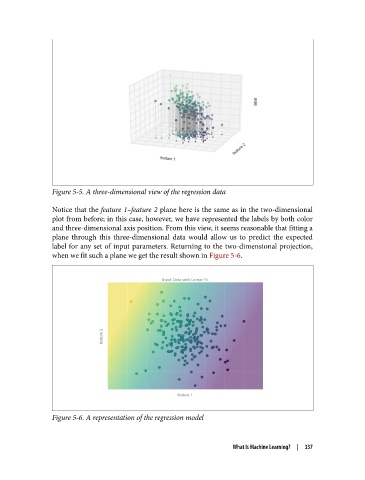
Figure 5-5. A three-dimensional view of the regression data

               Notice that the feature 1–feature 2 plane here is the same as in the two-dimensional
               plot from before; in this case, however, we have represented the labels by both color
               and three-dimensional axis position. From this view, it seems reasonable that fitting a
               plane through this three-dimensional data would allow us to predict the expected
               label for any set of input parameters. Returning to the two-dimensional projection,
               when we fit such a plane we get the result shown in Figure 5-6.


               Figure 5-6. A representation of the regression model


                                                                 What Is Machine Learning?  |  337