
Page 354 - Python Data Science Handbook
P. 354
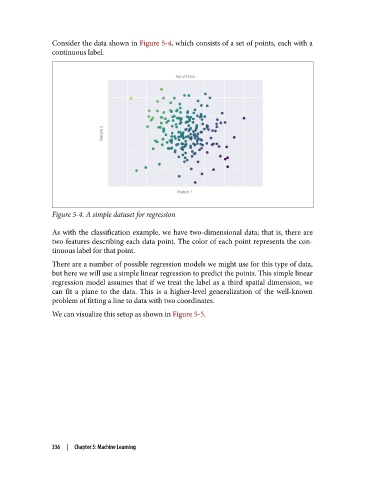
Consider the data shown in Figure 5-4, which consists of a set of points, each with a
               continuous label.


               Figure 5-4. A simple dataset for regression

               As with the classification example, we have two-dimensional data; that is, there are
               two features describing each data point. The color of each point represents the con‐
               tinuous label for that point.

               There are a number of possible regression models we might use for this type of data,
               but here we will use a simple linear regression to predict the points. This simple linear
               regression model assumes that if we treat the label as a third spatial dimension, we
               can fit a plane to the data. This is a higher-level generalization of the well-known
               problem of fitting a line to data with two coordinates.
               We can visualize this setup as shown in Figure 5-5.


               336  |  Chapter 5: Machine Learning