
Page 359 - Python Data Science Handbook
P. 359
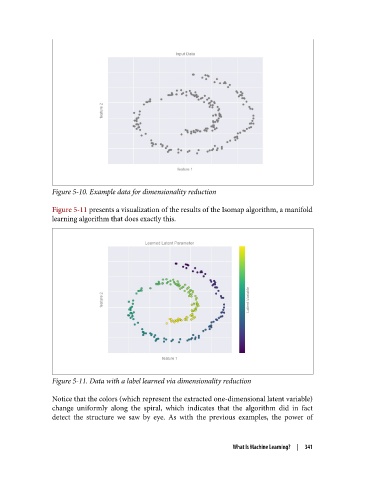
Figure 5-10. Example data for dimensionality reduction

               Figure 5-11 presents a visualization of the results of the Isomap algorithm, a manifold
               learning algorithm that does exactly this.


               Figure 5-11. Data with a label learned via dimensionality reduction

               Notice that the colors (which represent the extracted one-dimensional latent variable)
               change uniformly along the spiral, which indicates that the algorithm did in fact
               detect the structure we saw by eye. As with the previous examples, the power of


                                                                 What Is Machine Learning?  |  341