
Page 361 - Python Data Science Handbook
P. 361
Introducing Scikit-Learn
There are several Python libraries that provide solid implementations of a range of
machine learning algorithms. One of the best known is Scikit-Learn, a package that
provides efficient versions of a large number of common algorithms. Scikit-Learn is
characterized by a clean, uniform, and streamlined API, as well as by very useful and
complete online documentation. A benefit of this uniformity is that once you under‐
stand the basic use and syntax of Scikit-Learn for one type of model, switching to a
new model or algorithm is very straightforward.
This section provides an overview of the Scikit-Learn API; a solid understanding of
these API elements will form the foundation for understanding the deeper practical
discussion of machine learning algorithms and approaches in the following chapters.
We will start by covering data representation in Scikit-Learn, followed by covering the
Estimator API, and finally go through a more interesting example of using these tools
for exploring a set of images of handwritten digits.
Data Representation in Scikit-Learn
Machine learning is about creating models from data: for that reason, we’ll start by
discussing how data can be represented in order to be understood by the computer.
The best way to think about data within Scikit-Learn is in terms of tables of data.
Data as table
A basic table is a two-dimensional grid of data, in which the rows represent individ‐
ual elements of the dataset, and the columns represent quantities related to each of
these elements. For example, consider the Iris dataset, famously analyzed by Ronald
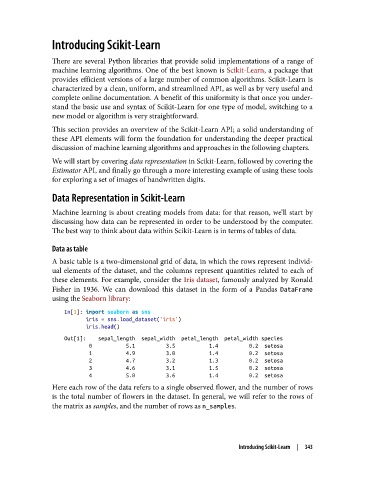
Fisher in 1936. We can download this dataset in the form of a Pandas DataFrame
using the Seaborn library:
In[1]: import seaborn as sns
iris = sns.load_dataset('iris')
iris.head()
Out[1]: sepal_length sepal_width petal_length petal_width species
0 5.1 3.5 1.4 0.2 setosa
1 4.9 3.0 1.4 0.2 setosa
2 4.7 3.2 1.3 0.2 setosa
3 4.6 3.1 1.5 0.2 setosa
4 5.0 3.6 1.4 0.2 setosa
Here each row of the data refers to a single observed flower, and the number of rows
is the total number of flowers in the dataset. In general, we will refer to the rows of
the matrix as samples, and the number of rows as n_samples.
Introducing Scikit-Learn | 343