
Page 369 - Python Data Science Handbook
P. 369
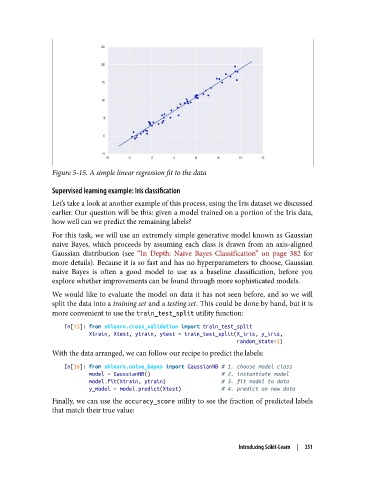
Figure 5-15. A simple linear regression fit to the data

               Supervised learning example: Iris classification
               Let’s take a look at another example of this process, using the Iris dataset we discussed
               earlier. Our question will be this: given a model trained on a portion of the Iris data,
               how well can we predict the remaining labels?

               For this task, we will use an extremely simple generative model known as Gaussian
               naive Bayes, which proceeds by assuming each class is drawn from an axis-aligned
               Gaussian distribution (see “In Depth: Naive Bayes Classification”  on page 382  for
               more details). Because it is so fast and has no hyperparameters to choose, Gaussian
               naive Bayes is often a good model to use as a baseline classification, before you
               explore whether improvements can be found through more sophisticated models.
               We would like to evaluate the model on data it has not seen before, and so we will
               split the data into a training set and a testing set. This could be done by hand, but it is
               more convenient to use the train_test_split utility function:

                   In[15]: from sklearn.cross_validation import train_test_split
                           Xtrain, Xtest, ytrain, ytest = train_test_split(X_iris, y_iris,
                                                                           random_state=1)
               With the data arranged, we can follow our recipe to predict the labels:

                   In[16]: from sklearn.naive_bayes import GaussianNB # 1. choose model class
                           model = GaussianNB()                       # 2. instantiate model
                           model.fit(Xtrain, ytrain)                  # 3. fit model to data
                           y_model = model.predict(Xtest)             # 4. predict on new data
               Finally, we can use the accuracy_score utility to see the fraction of predicted labels
               that match their true value:


                                                                   Introducing Scikit-Learn  |  351