
Page 374 - Python Data Science Handbook
P. 374
manifold learning algorithm called Isomap (see “In-Depth: Manifold Learning” on
page 445), and transform the data to two dimensions:
In[26]: from sklearn.manifold import Isomap
iso = Isomap(n_components=2)
iso.fit(digits.data)
data_projected = iso.transform(digits.data)
data_projected.shape
Out[26]: (1797, 2)
We see that the projected data is now two-dimensional. Let’s plot this data to see if we
can learn anything from its structure (Figure 5-19):
In[27]: plt.scatter(data_projected[:, 0], data_projected[:, 1], c=digits.target,
edgecolor='none', alpha=0.5,
cmap=plt.cm.get_cmap('spectral', 10))
plt.colorbar(label='digit label', ticks=range(10))
plt.clim(-0.5, 9.5);
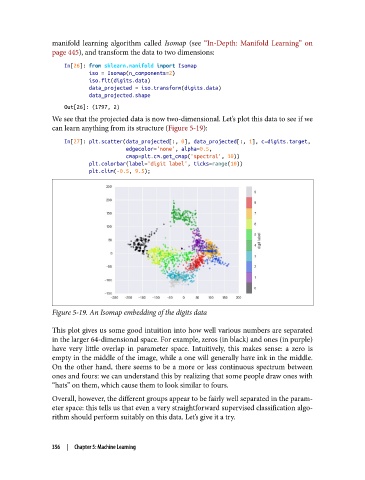
Figure 5-19. An Isomap embedding of the digits data
This plot gives us some good intuition into how well various numbers are separated
in the larger 64-dimensional space. For example, zeros (in black) and ones (in purple)
have very little overlap in parameter space. Intuitively, this makes sense: a zero is
empty in the middle of the image, while a one will generally have ink in the middle.
On the other hand, there seems to be a more or less continuous spectrum between
ones and fours: we can understand this by realizing that some people draw ones with
“hats” on them, which cause them to look similar to fours.
Overall, however, the different groups appear to be fairly well separated in the param‐
eter space: this tells us that even a very straightforward supervised classification algo‐
rithm should perform suitably on this data. Let’s give it a try.
356 | Chapter 5: Machine Learning