
Page 371 - Python Data Science Handbook
P. 371
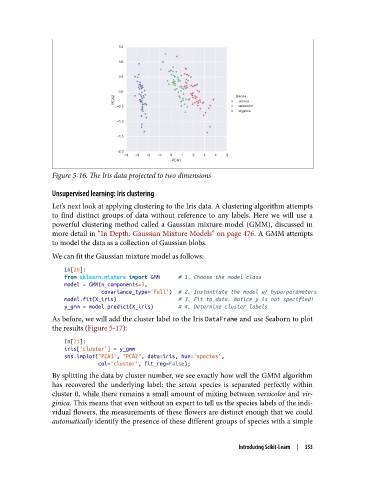
Figure 5-16. The Iris data projected to two dimensions

               Unsupervised learning: Iris clustering

               Let’s next look at applying clustering to the Iris data. A clustering algorithm attempts
               to find distinct groups of data without reference to any labels. Here we will use a
               powerful clustering method called a Gaussian mixture model (GMM), discussed in
               more detail in “In Depth: Gaussian Mixture Models” on page 476. A GMM attempts
               to model the data as a collection of Gaussian blobs.
               We can fit the Gaussian mixture model as follows:

                   In[20]:
                   from sklearn.mixture import GMM      # 1. Choose the model class
                   model = GMM(n_components=3,
                               covariance_type='full')  # 2. Instantiate the model w/ hyperparameters
                   model.fit(X_iris)                    # 3. Fit to data. Notice y is not specified!
                   y_gmm = model.predict(X_iris)        # 4. Determine cluster labels
               As before, we will add the cluster label to the Iris DataFrame and use Seaborn to plot
               the results (Figure 5-17):
                   In[21]:
                   iris['cluster'] = y_gmm
                   sns.lmplot("PCA1", "PCA2", data=iris, hue='species',
                              col='cluster', fit_reg=False);
               By splitting the data by cluster number, we see exactly how well the GMM algorithm
               has recovered the underlying label: the setosa  species is separated perfectly within
               cluster 0, while there remains a small amount of mixing between versicolor and vir‐
               ginica. This means that even without an expert to tell us the species labels of the indi‐
               vidual flowers, the measurements of these flowers are distinct enough that we could
               automatically identify the presence of these different groups of species with a simple


                                                                   Introducing Scikit-Learn  |  353