
Page 375 - Python Data Science Handbook
P. 375
Classification on digits
Let’s apply a classification algorithm to the digits. As with the Iris data previously, we
will split the data into a training and test set, and fit a Gaussian naive Bayes model:
In[28]: Xtrain, Xtest, ytrain, ytest = train_test_split(X, y, random_state=0)
In[29]: from sklearn.naive_bayes import GaussianNB
model = GaussianNB()
model.fit(Xtrain, ytrain)
y_model = model.predict(Xtest)
Now that we have predicted our model, we can gauge its accuracy by comparing the
true values of the test set to the predictions:
In[30]: from sklearn.metrics import accuracy_score
accuracy_score(ytest, y_model)
Out[30]: 0.83333333333333337
With even this extremely simple model, we find about 80% accuracy for classification
of the digits! However, this single number doesn’t tell us where we’ve gone wrong—
one nice way to do this is to use the confusion matrix, which we can compute with
Scikit-Learn and plot with Seaborn (Figure 5-20):
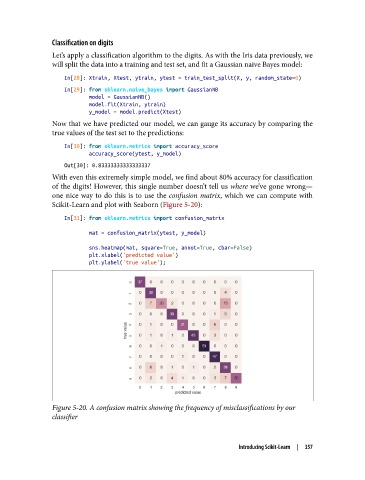
In[31]: from sklearn.metrics import confusion_matrix
mat = confusion_matrix(ytest, y_model)
sns.heatmap(mat, square=True, annot=True, cbar=False)
plt.xlabel('predicted value')
plt.ylabel('true value');
Figure 5-20. A confusion matrix showing the frequency of misclassifications by our
classifier
Introducing Scikit-Learn | 357