
Page 46 - Python Data Science Handbook
P. 46
For more information on %prun, as well as its available options, use the IPython help
functionality (i.e., type %prun? at the IPython prompt).
Line-by-Line Profiling with %lprun
The function-by-function profiling of %prun is useful, but sometimes it’s more conve‐
nient to have a line-by-line profile report. This is not built into Python or IPython,
but there is a line_profiler package available for installation that can do this. Start
by using Python’s packaging tool, pip, to install the line_profiler package:
$ pip install line_profiler
Next, you can use IPython to load the line_profiler IPython extension, offered as
part of this package:
In[9]: %load_ext line_profiler
Now the %lprun command will do a line-by-line profiling of any function—in this
case, we need to tell it explicitly which functions we’re interested in profiling:
In[10]: %lprun -f sum_of_lists sum_of_lists(5000)
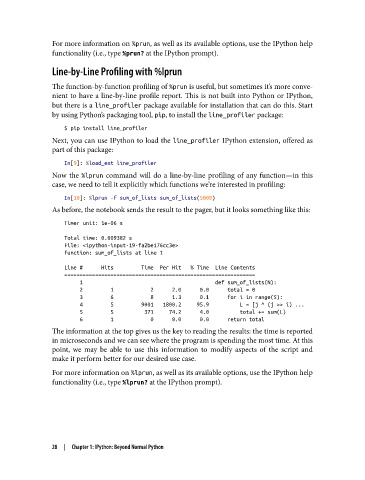
As before, the notebook sends the result to the pager, but it looks something like this:
Timer unit: 1e-06 s
Total time: 0.009382 s
File: <ipython-input-19-fa2be176cc3e>
Function: sum_of_lists at line 1
Line # Hits Time Per Hit % Time Line Contents
==============================================================
1 def sum_of_lists(N):
2 1 2 2.0 0.0 total = 0
3 6 8 1.3 0.1 for i in range(5):
4 5 9001 1800.2 95.9 L = [j ^ (j >> i) ...
5 5 371 74.2 4.0 total += sum(L)
6 1 0 0.0 0.0 return total
The information at the top gives us the key to reading the results: the time is reported
in microseconds and we can see where the program is spending the most time. At this
point, we may be able to use this information to modify aspects of the script and
make it perform better for our desired use case.
For more information on %lprun, as well as its available options, use the IPython help
functionality (i.e., type %lprun? at the IPython prompt).
28 | Chapter 1: IPython: Beyond Normal Python