
Page 41 - Python Data Science Handbook
P. 41
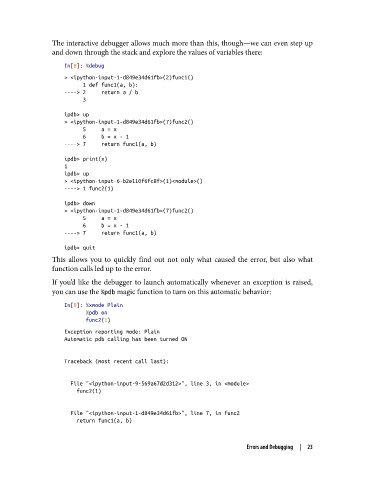
The interactive debugger allows much more than this, though—we can even step up
               and down through the stack and explore the values of variables there:

                   In[8]: %debug
                   > <ipython-input-1-d849e34d61fb>(2)func1()
                         1 def func1(a, b):
                   ----> 2     return a / b
                         3
                   ipdb> up
                   > <ipython-input-1-d849e34d61fb>(7)func2()
                         5     a = x
                         6     b = x - 1
                   ----> 7     return func1(a, b)

                   ipdb> print(x)
                   1
                   ipdb> up
                   > <ipython-input-6-b2e110f6fc8f>(1)<module>()
                   ----> 1 func2(1)
                   ipdb> down
                   > <ipython-input-1-d849e34d61fb>(7)func2()
                         5     a = x
                         6     b = x - 1
                   ----> 7     return func1(a, b)
                   ipdb> quit
               This allows you to quickly find out not only what caused the error, but also what
               function calls led up to the error.

               If you’d like the debugger to launch automatically whenever an exception is raised,
               you can use the %pdb magic function to turn on this automatic behavior:

                   In[9]: %xmode Plain
                          %pdb on
                          func2(1)

                   Exception reporting mode: Plain
                   Automatic pdb calling has been turned ON


                   Traceback (most recent call last):


                     File "<ipython-input-9-569a67d2d312>", line 3, in <module>
                       func2(1)


                     File "<ipython-input-1-d849e34d61fb>", line 7, in func2
                       return func1(a, b)


                                                                     Errors and Debugging  |  23