
Page 45 - Python Data Science Handbook
P. 45
In[6]: %%time
total = 0
for i in range(1000):
for j in range(1000):
total += i * (-1) ** j
CPU times: user 504 ms, sys: 979 µs, total: 505 ms
Wall time: 505 ms
For more information on %time and %timeit, as well as their available options, use
the IPython help functionality (i.e., type %time? at the IPython prompt).
Profiling Full Scripts: %prun
A program is made of many single statements, and sometimes timing these state‐
ments in context is more important than timing them on their own. Python contains
a built-in code profiler (which you can read about in the Python documentation), but
IPython offers a much more convenient way to use this profiler, in the form of the
magic function %prun.
By way of example, we’ll define a simple function that does some calculations:
In[7]: def sum_of_lists(N):
total = 0
for i in range(5):
L = [j ^ (j >> i) for j in range(N)]
total += sum(L)
return total
Now we can call %prun with a function call to see the profiled results:
In[8]: %prun sum_of_lists(1000000)
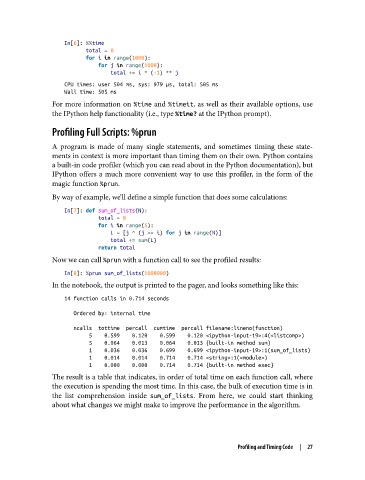
In the notebook, the output is printed to the pager, and looks something like this:
14 function calls in 0.714 seconds
Ordered by: internal time
ncalls tottime percall cumtime percall filename:lineno(function)
5 0.599 0.120 0.599 0.120 <ipython-input-19>:4(<listcomp>)
5 0.064 0.013 0.064 0.013 {built-in method sum}
1 0.036 0.036 0.699 0.699 <ipython-input-19>:1(sum_of_lists)
1 0.014 0.014 0.714 0.714 <string>:1(<module>)
1 0.000 0.000 0.714 0.714 {built-in method exec}
The result is a table that indicates, in order of total time on each function call, where
the execution is spending the most time. In this case, the bulk of execution time is in
the list comprehension inside sum_of_lists. From here, we could start thinking
about what changes we might make to improve the performance in the algorithm.
Profiling and Timing Code | 27